Troubleshooting MS SQL Server is something that comes from years of experience and there is a certain amount of pride that comes with mastering the level of knowledge needed to do a good job. The internals and the way the optimizer works are complex enough without having to master the various ways hardware and OS plays a role. This combined with the myriad of ways that a query can be written introduces a whole new dimension to the art of troubleshooting MSSQL server. In fact, this is the main reason why you almost never get a straightforward answer to a performance issue in SQL Server. Anyone who has worked in SQL Server long enough has often heard the term “It Depends”.
In this post I am going to try and dilute some of the knowledge so that a beginner in SQL Server can still find the right root cause to a performance issue 7 out of 10 times. The Query store is a sort of repository of query metadata such as resource utilization, execution plans, query details etc. All of which comes in very handy when we have to troubleshoot issues in real time. There is a ton of stuff that we can discuss when it comes to query store and I won’t get into a deep dive because nobody reads anymore.
Simply speaking if you know when the issue occurred, we can use the time stamp to identify what was running on the system at that time and how many resources it used. This will help narrow down the problem queries and then we can look into what can be done to fix it.
I am using an On-Premise SQL database for the purpose of this demo but the principles are the same for Azure SQL databases too. The post will guide you step by step on how to work with the DMVs for query store in MSSQL Server.
Note the timestamp
The first thing you need in order to troubleshoot the issues is to make sure you have Query Store enabled and working. Please use this link in order to understand how to setup query store. Assuming you already have Query store setup and working we only need the timestamp for when the issue occurred. Please note the timestamp is in UTC.
Get the corresponding time interval
Query store has an internal DMV that is used to keep track of one-hour intervals when the data is captured, the details of the timestamp interval id can be found by running the below query.
-- Set @issuetime to the desired timestamp, or use GETUTCDATE() for current UTC time
DECLARE @issuetime DATETIME = GETUTCDATE();

SELECT *
FROM sys.query_store_runtime_stats_interval
WHERE @issuetime >= start_time
        -- Check if @issuetime falls between start_time and end_time (inclusive)
        AND @issuetime <= end_time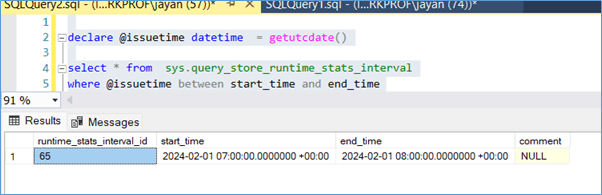
In this case I am assuming the issue happened in the last one hour. I get the interval Id as 65
Identify queries that were running during the time interval
In order to find what was running during interval id 65 simply run the query below. The below results table is huge and has a lot of information such as the plan_id for the query that was executing, the time it ran first and last, if the query was “Aborted” , execution count, the CPU , Memory , IO and other details.
SELECT qrsrs.*
FROM sys.query_store_runtime_stats AS qrsrs
WHERE qrsrs.runtime_stats_interval_id = @RuntimeStatsIntervalId;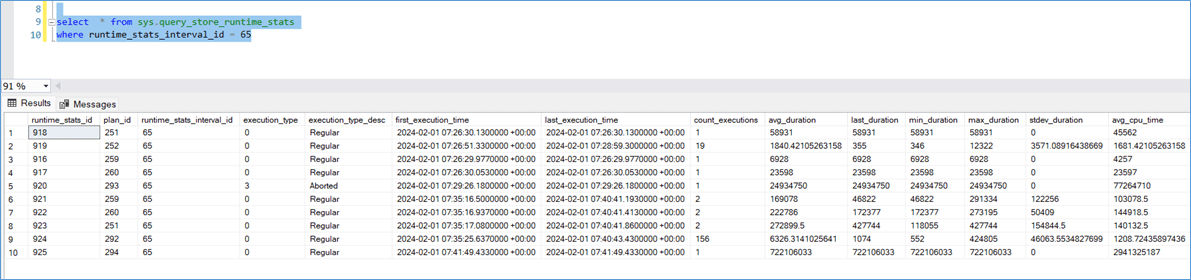
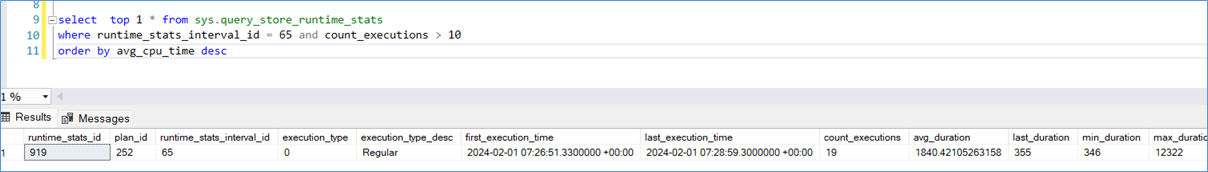
So, if I was looking for the query that was running the longest, I would modify the previous query as
/*
    Retrieves the query runtime statistics with the highest maximum duration
    for a specific runtime_stats_interval_id from the Query Store.

    - SELECT TOP 1 *: Returns only the single row with the highest max_duration.
    - FROM sys.query_store_runtime_stats: Uses the Query Store system view to access runtime statistics.
    - WHERE runtime_stats_interval_id = 65: Filters results to a specific interval (ID 65).
    - ORDER BY max_duration DESC: Orders results by maximum duration in descending order to get the longest-running query.

    Best Practices:
    - Replace SELECT * with explicit column names for better performance and maintainability.
    - Parameterize the interval ID if used in scripts or procedures.
    - Ensure Query Store is enabled and collecting data for accurate results.
*/
SELECT TOP 1 *
FROM sys.query_store_runtime_stats
WHERE runtime_stats_interval_id = 65
ORDER BY max_duration DESC
For a query that runs frequently and uses a lot of CPU I would use the query as shown in the screenshot below. Write the query to fetch the metric you are interested in. Normally this information is provided to you by the support team in an email “there was a CPU spike at 6:00 Am today could you please have a look” so you know you are looking for CPU intensive queries. If you get an email saying the server was “slow”. I would start with long running queries since most probably you are looking at locking and blocking issues so the query was “stuck”. When in doubt get the top worst performer for each of the below categories
- Max_duration ( long running transaction , locking , blocking etc)
- Avg_cpu_time ( consistently high CPU)
- Max_cpu_time (spike in CPU)
- Max_rowcount (query that is fetching large amount of data, reporting query , missing where etc)
- Avg_query_max_used_memory ( high mem usage)
- Avg_tempdb_space_used ( high tempdb usage – mostly data doesn’t fit in RAM , insufficient memory granted , large group by etc)
Use Plan id for the query to get execution plan
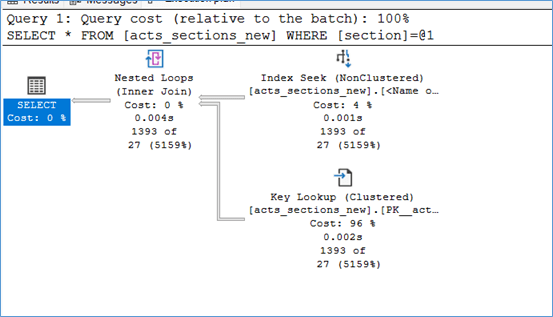
You have the plan_id, so you can jump right into looking at the execution plan at this point. In order to this, you can use the below query to pick up the execution plan details. For example, in the above screenshot you can see my plan_id = 252. Notice the query_plan column, you can copy paste the contents into a notepad file and save it as sqlplan in order to view the plan in the GUI. Notice that further to right you will also have details like the compile time etc. Keep in mind CPU time = Compile time + Query exec time so its important to know if the CPU is used by SQL server to create a plan or to execute a query.
-- Query to retrieve information about a specific Query Store plan by plan_id
-- Best Practices:
--   1. Use schema qualification (already present: sys.query_store_plan)
--   2. Avoid SELECT * in production; specify columns for clarity and performance
--   3. Use parameters or variables for plan_id if used in scripts or procedures
--   4. Add comments for maintainability

-- Example with explicit columns and parameterization
DECLARE @PlanId INT = 252;

SELECT
    plan_id,
    query_id,
    engine_version,
    compatibility_level,
    query_plan,
    -- Add other columns as needed
    last_execution_time,
    count_compiles,
    count_executions
FROM sys.query_store_plan
WHERE plan_id = @PlanId;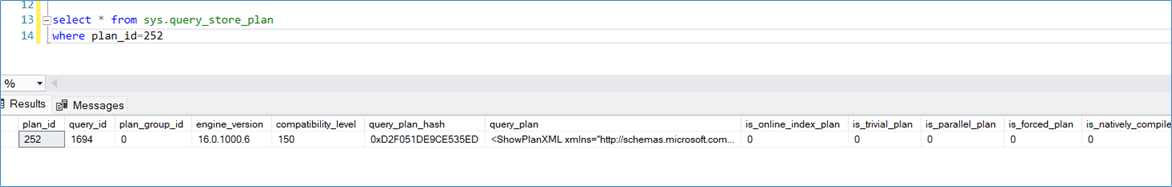
If you are really lazy you can use the below query to directly view the plan in SSMS
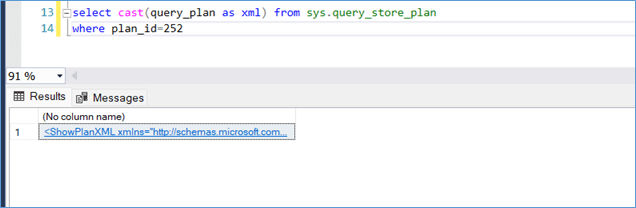
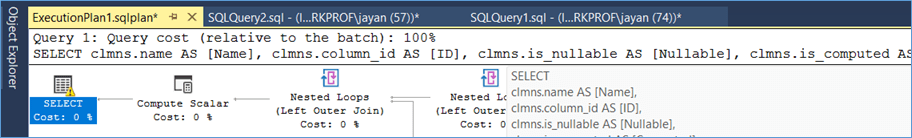
And there you have it, when you view the execution plan you also have the query that was used to create the plan. Note that the variable values are not provided in the query text so you can’t really use this to duplicate the exact user behaviour.
Get the Query Hash ( for GUI and Forcing plan if needed)
If you want to look for the exact query information then we can go one step further and run the below query. I am passing the query_id 1694 from the screenshot at the start of step 4 here. I highly encourage readers to scroll to the end of the tables and view all the columns that are available at the end of the table .
SELECT *
FROM sys.query_store_query
-- Filters the results to include only rows where the query_Id is equal to 1694.
WHERE query_id = 1694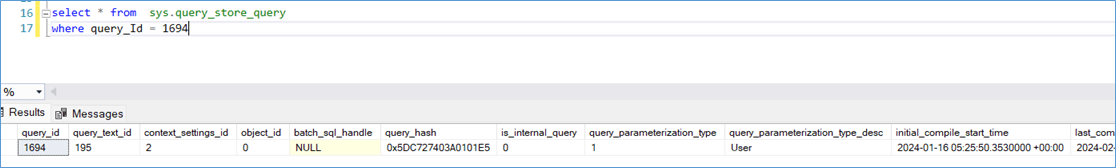
From the above screenshot we are interested in the Query_text_id 195 which we will use in the next step. Notice in the above screenshot you have a column called Query_hash, this is an important value if you want to use the GUI to look into specifics query without having to write queries.
Get the Query text
As you can see from the below screenshot, we now have the query text as well, this can be used to identify if the query comes from a stored procedure or it is application related like auto generated query from a ORM tool for example.
SELECT *
FROM sys.query_store_query_text
-- Filters the results to include only rows where the query_text_id is equal to 195.
WHERE query_text_id = 195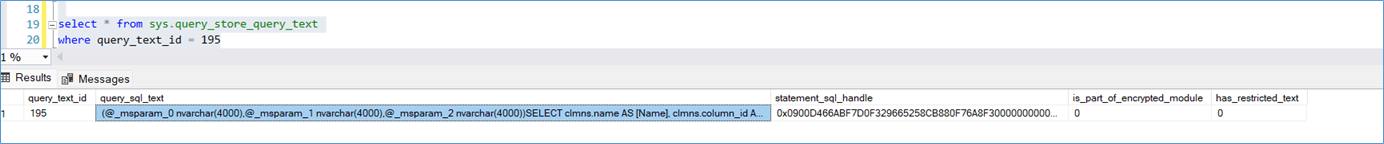
Needless to say, the whole process can be reversed if you want to identify the performance impact of a query over time, for example you deployed a procedure to production and now its not working as well as it used to. Then start from step 6 and work your way up.
All the stuff I mentioned above can be easily accessed from the GUI as well and it is worth exploring when you are in a hurry. However, keep in mind graphs have a tendency combine data under a single grouping and this can hide queries that generally run fine but occasionally cause severe issues.