Configure Query Store
Query Store is a powerful feature in Microsoft SQL Server that serves as a performance monitoring and troubleshooting tool. It essentially acts as a database-wide flight data recorder, capturing and storing query execution plans along with runtime statistics. This allows database administrators to track changes in query performance over time, identify performance regressions, and analyse trends. Query Store provides insights into query execution plans, enabling better optimization strategies and helping to ensure stable and efficient database performance. Its key benefits include simplifying performance tuning, aiding in historical analysis, and providing a safety net against sudden performance degradation. In essence, Query Store is a valuable tool for database administrators and developers, offering a comprehensive solution to proactively manage and enhance SQL Server query performance.
Setting up Query store is fairly straight forward; the below query will help you get started asap with minimal effort
Using TSQL
-- Enable Query Store

ALTER DATABASE [YourDatabase] SET QUERY_STORE = ON;

-- Configure Query Store options

ALTER DATABASE [YourDatabase] SET QUERY_STORE (

OPERATION_MODE = READ_WRITE,

DATA_FLUSH_INTERVAL_SECONDS = 900,

CLEANUP_POLICY = (STALE_QUERY_THRESHOLD_DAYS = 30)

);
Using SSMS
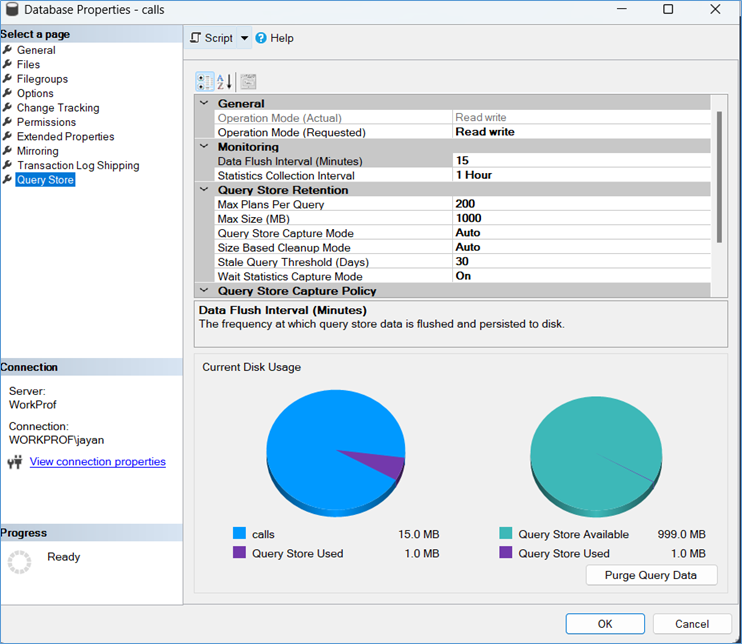
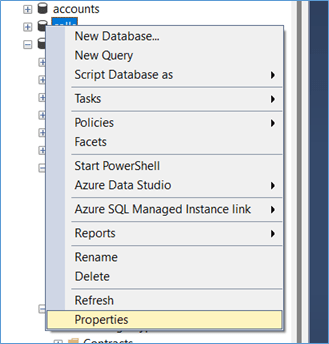
The below screenshot shows the User Interface for configuring Query store. We will dive deeper into its individual options later on in this post. Simply Right click and navigate to the properties of the database you are interested in.

Under the properties window you will see the option for query store.

General Options
Under General Options we have Operation Mode (Actual and Requested). Query store captures query execution data. Anyone working on SQL Server for a long time know how gathering this kind of data can itself cause issues in older systems. Profiler is a good example of how we used to capture this info. Since Query store when configured incorrectly can capture a huge volume of data we have the option to set it as below: –

Off – Query Store isn’t running; no data is being captured and no analytics is possible since the features itself is disabled
Read Write: – Query store is running and capturing data in real time (Write) the data that is being captured is immediately available for analysis (Read).
Read only – The data that has been captured previously is available for Analysis but no new data is being captured. Normally the DBA might switch off Query Store at times when there is no issues with the database and there is not troubleshooting being done. However, there is a limit that can be configured to make sure Query store doesn’t grow too large. In case this limit is reached the Server might automatically switch query store to read Only mode from read write.
Monitoring
Under this tab we have granular control of how frequently data is captured and the granularity at which it is saved.

Data Flush Interval(minutes) – The data that is being captured is initially saved in the RAM as part of a ring Buffer (like extended events), the data is then flushed to disk after the number of minutes defined in this property. Setting too low a value will result in frequent writes to the DB (impacting log file etc), Too high and value and there is a chance you might lose data in the event of an unexpected shutdown and excessive memory usage by Query store. For example, if you set it as 15 then every 15 minutes the data is flushed from memory and written to disk. So, in there is a unexpected shutdown you could lose up to 15 minutes of QS data.
Statistics Collection Interval – There are a number of metrics being captured in Query store, this data in its raw from can result in millions of rows in the internal tables. In order to control this behaviour, you have the option to aggregate the raw data in time intervals ranging from 1 minute to 1 Day. This means if a query runs once an hour it can have one entry in the table if the Statistics Collection Interval is set to 1 day, and 24 entries if it is set to 1 hour. Please refer this link to view the data in the internal tables (Step 2).
Query Store Retention
As mentioned previously QS can capture a wealth of information and since its can do this at a granular level there is a possibility it will grow in size quickly. In order to mange this behaviour we have the options mentioned below.

Max Plans Per Query: – This property limits the number of execution plans captured for any given query to 200. A query can still have more than 200 execution plans ( a common problem with ORM tools that hard code values into the query text instead of using parameterization). Ideally a procedure may have less than 10 executions plans and this feature is only really helpful when troubleshooting parameter sniffing issue. Its rare for a good query to have more than 1-5 executions plans at most. Ideally set this to 50 since execution plan data is very large XML data can eat up a ton of space unnecessarily.
Max Size (MB): – The query store captures a ton of data and left uncontrolled and consume 100s of GB of space on a busy OLTP system. Setting a max size limits this behaviour so that query QS will switch from read write to read only mode and prevent the data from becoming too large.
Query Store Capture Mode: – This option helps QS prioritize what kind of data needs to be captured. The options are
- All – Capture details for every query that has run against the database.
- Auto – Captures only queries that are resource intensive, ideal for servers that don’t have any issues at the moment and you only need a basic level of monitoring.
- None – As its name suggest doesn’t capture any info, mainly a substitute for switching off QS.
- Custom – A recent addition that allows the user to configure what kind of information they want to track , more details available here.
Size based Cleanup Mode: – This property has two options, Auto where it automatically trims (deletes old data from the QS when the volume approaches the size limit) or Off where the feature doesn’t trim the data and the QS will switch to Read Only when the limit is reached. For a heavily utilized OLTP system it’s possible the cleanup mode might flush data out of the QS before the DBA had a chance to analyse it, so use with caution.
Stale Query Threshold (Days): – As the name suggested it helps the Size based Cleanup Mode identify what data can be trimmed from the query store by looking at the number of dates old the data should be before its considered stale. For example, if the value is 30 days as in the above screenshot. When a cleanup occurs any data older than 30 days will be deleted and no longer available in the QS for analysis. The data can still be found in a backup file if you have one.
Wait Statistics Capture Mode: – Other than detailed query level information it is useful to gather server level information such as wait statistics which plays a crucial role in troubleshooting server wide issues. Setting this option to On ensures the wait stats are available to add additional context to the query level details that are captured.
Query Store Capture policy
This window is available only if the option for Query Store Capture Mode (mentioned previously) is set to custom. It defines additional criteria that must be satisfied before the query details are captured.

Execution Count: – A query must be executed 30 times before its details are captured. This is a double edges sword since it can easily miss ad hoc query or a query that doesn’t execute regularly but is a problem regardless.
Stale Threshold: – Gather the above details under the context of a one-hour interval, it is the difference between a query that executed 30 time in a hour vs 30 times in a day.
Total Compile CPU Time(ms): – Capture only query info for queries where the Total Compile time exceeds the threshold specified above. This is useful for queries which compile frequently like ORM queries etc.
Total Execution CPU Time(ms): – Capture only query info for queries that have a total execution CPU time greater than 100 ms, useful for capturing queries that consume High CPU.
And there you have it, everything you need to setup and configure in order to have query store working.
Oh wait
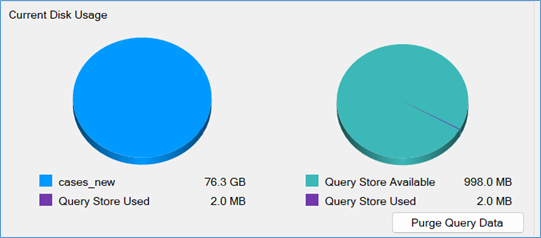
Finished analysing the performance issue and want to flush the QS and capture data afresh. Click Purge Query Data to delete all info in the QS and start a fresh collection of performance data.

