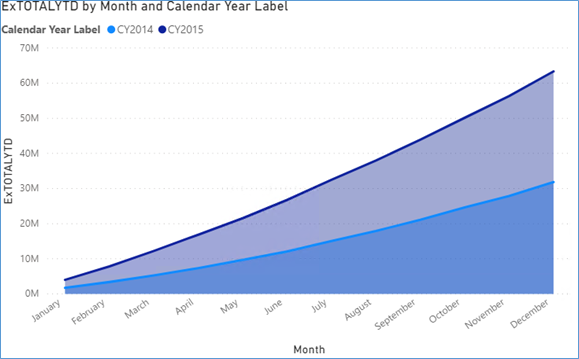
A very useful kind of report is called a cumulative report. Which is based on summarizing data cumulatively. This means we can see the area chart as progressively growing as the year goes by. Charts such as these provide a clear indication of the long term trajectory of the sales and clearly indicates Sales for 2015 are well above 2014.
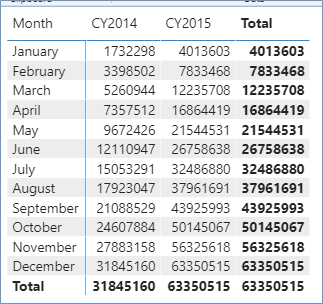
The same data visualized as a table will look as shown below
In order to create such charts we need to use the TOTALYTD, QTD or MTD functions to summarize data based on the calendar dates.
The function will look as shown below
ExTOTALYTD = TOTALYTD(SUM('Fact Purchase'[Ordered Quantity]),'Dimension Date'[Date])In the above example we are adding the Order QTY for each year starting from Jan to Dec based on the dates available in the table Dimension Date.
The SQL equivalent for the above DAX function would be similar to the query below
SELECT d.[Calendar Year]
    ,sum(o.Quantity)
FROM Dimension.DATE d
INNER JOIN Fact.[Order] o ON d.DATE = o.[Order Date Key]
WHERE d.DATE BETWEEN cast(year('2013-01-01') AS VARCHAR(4)) + '-01-01'
        AND cast('2013-05-01' AS DATE)
GROUP BY d.[Calendar Year]
Please Consider Subscribing