The good thing about KQL is that the syntax is familiar to those who use TSQL, and any other RDBMS query language. This makes sense because the purpose is very similar. This coupled with the fact that there is almost zero administration over head such as learning how to back up a database or index a table etc learning how to normalize the data makes it much easier to learn.
The basic data structure used in KQL is the same as SQL Server, all data is saved in tables. An important distinction between RDBMS tables and KQL tables are that tables in KQL can contain different types of data. For example in a traditional database we might have one table for customers and another address and another for purchase. In KQL all this data might be found within the same table, an example of this can be seen in the below cheat sheet ID 3.
Lets explore this further in the form of a cheat sheet
| ID | TSQL | KQL | Keywords |
| 1 | Select * from RawServerMetrics | RawServerMetrics | TableName |
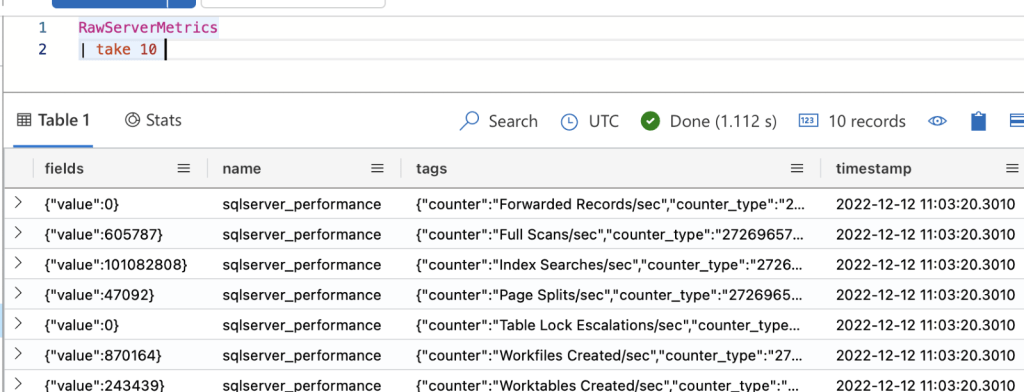
| 2 | Select top 10 * from RawServerMetrics | RawServerMetrics |limit 10 | Limit |
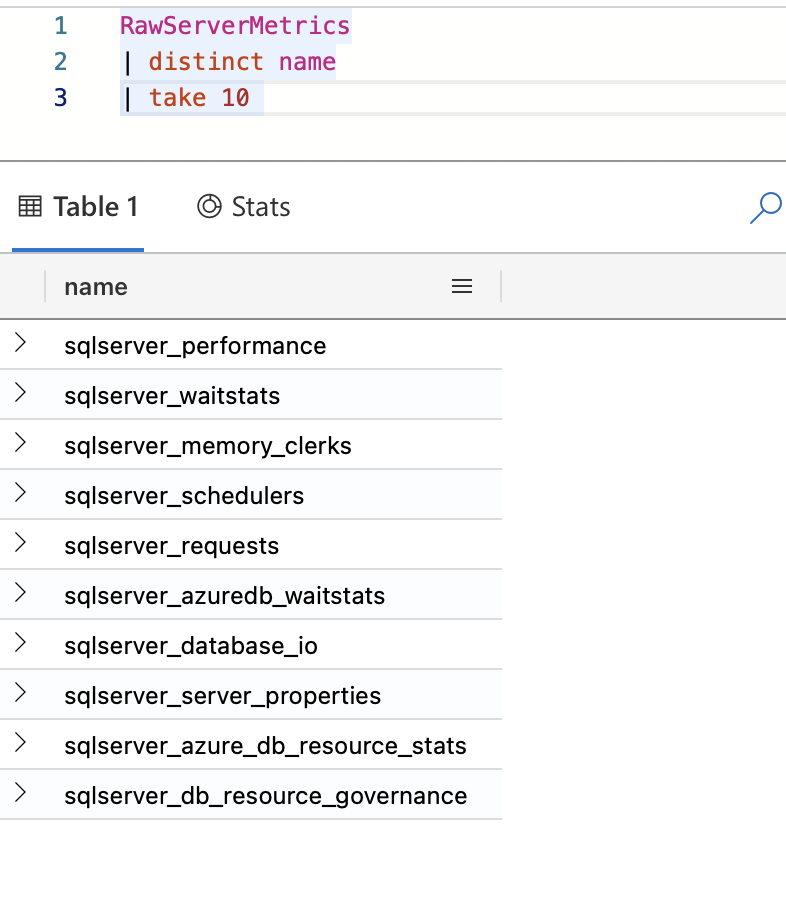
| 3 | Select top 10 distinct name from RawServerMetrics | RawServerMetrics | distinct name | take 10 | Distinct |
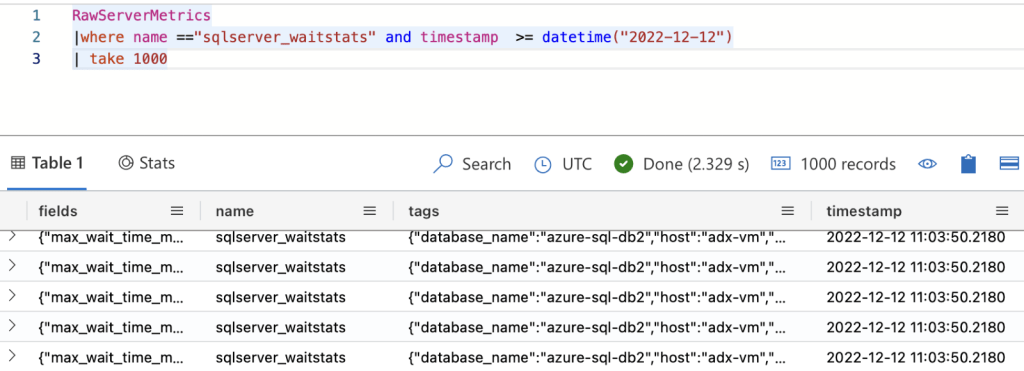
| 4 | Select top 1000 * from RawServerMetrics where name =’ sqlserver_waitstats ’ and timestamp >= ‘2022-12-12 ’ | RawServerMetrics |where name ==”sqlserver_waitstats” and timestamp >= datetime(“2022-12-12”) | take 1000 | Where |
| 5 | Select top 1000 timestamp, fields , name , tags From RawServerMetrics where name =’ sqlserver_waitstats ’ and timestamp >= ‘2022-12-12 ’ | RawServerMetrics |project timestamp , fields, name , tags |where name ==”sqlserver_waitstats” and timestamp >= datetime(“2022-12-12”) | take 1000 | Project |
| 6 | Select top 1000 timestamp, fields , name , tags, Datepart(hh,timestamp) From RawServerMetrics where name =’ sqlserver_waitstats ’ and timestamp >= ‘2022-12-12 ’ | RawServerMetrics |project timestamp , fields, name , tags |extend hour= datetime_part(‘hour’,timestamp) |where name ==”sqlserver_waitstats” and timestamp >= datetime(“2022-12-12”) | take 1000 | extend |
| 7 | Select top 1000 timestamp, fields , name , tags,JSON_VAKUE(tags,’$.wait_type’) as Wait_type From RawServerMetrics where name =’ sqlserver_waitstats ’ and timestamp >= ‘2022-12-12 ’ | RawServerMetrics |project timestamp , fields, name , tags |extend d= parse_json(tags) |extend wait_type =d.wait_type |where name ==”sqlserver_waitstats” and timestamp >= datetime(“2022-12-12”) | take 1000 | Prase_json A lot of the metrics data is saved as JSON and you will find the prase_json fucntion useful to extract the data from the dataset and display it as a column. |
Example of the output for ID 2
Example of Screenshot 3
As you can see the table RawServerMetrics has different types of metrics such as wait stats, performance counters etc. In a traditional database there would be saved in different tables each with its own name. Here they are stored in the same table and differentiated by the name column.
Screenshot for Id 4
Notice how when using date in where condition there is an explcit conversion required since the data is orginally string.
Example for id 5
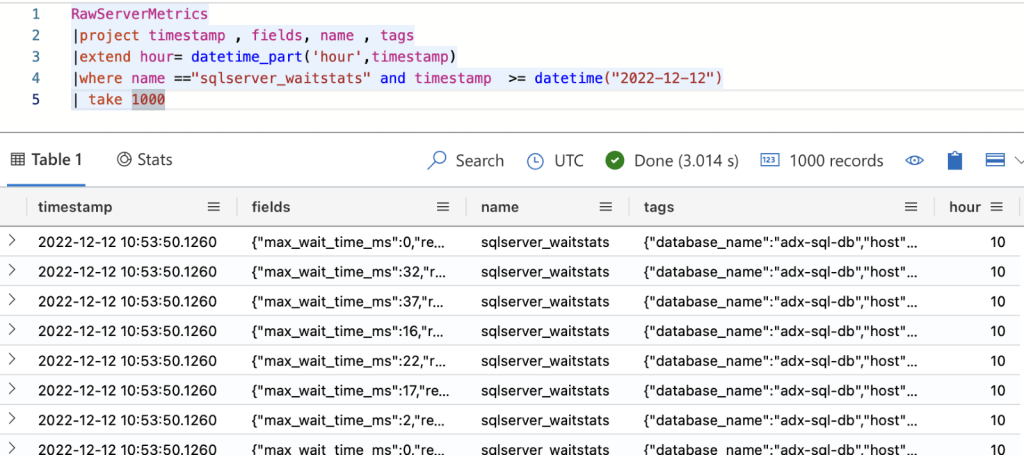
Example for ID 6
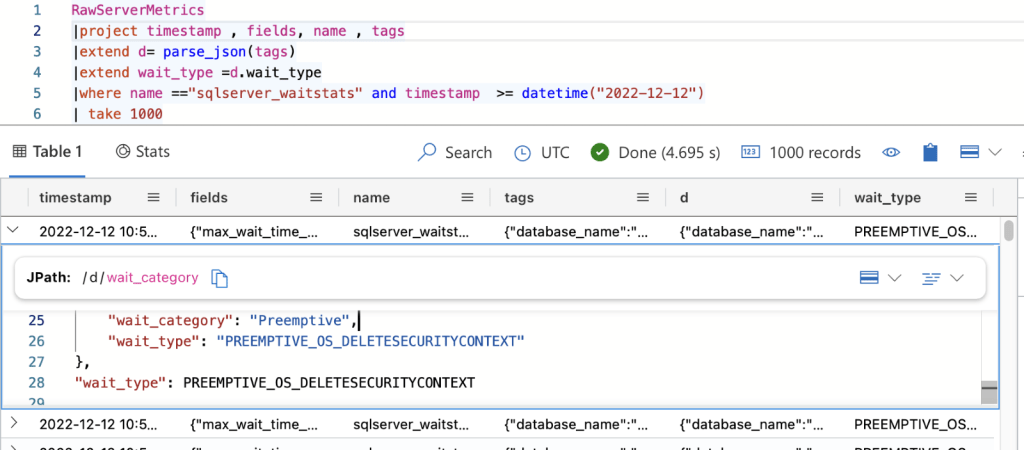
Example for ID 7
