Over the holidays I have been looking to try out some new concepts in SQL Server and figured I should perform some analysis on all the emails I have received in the last 5 years. The idea started out with me just wanting to know some basic info like the list of companies and employees I interact with or vice versa. This later turned into more detailed analysis on Avg duration between replies and Avg messages per action and a correlation between number of messages exchanged and the revenue generated per client. While all this resulted in some useful insight, this blog is more focused on one aspect in particular and that is creating a network graph. A network graph unlike what its name suggests isn’t a pictorial representation of all the devices in your network and how they are connected (but the analogy does help). If you replace the computers with people and the cables with interactions, the resulting diagram gives an idea of how people are related.
This concept is especially useful in social technologies to identify influencers in decision making etc. and is one of the reasons for my blog post.A network graph can help provide some quick info on how the company operates and who the key decision makers are. It also helps quickly categorize interactions. While performing the analysis I broke down the interaction into 4 parts
The From-Company– Since the messages originate at the company level, this is the left hand side point which acts as the source.
The From Address – Since the mail can be triggered from any employee within the company, this is the point of intersection of the line from source to the dotted line senders , each intersection represents a unique email id.
The To-Address – the recipient of the email, (this can include multiple email accounts belonging to different companies.)
The To-Company – the Company the recipient belongs to
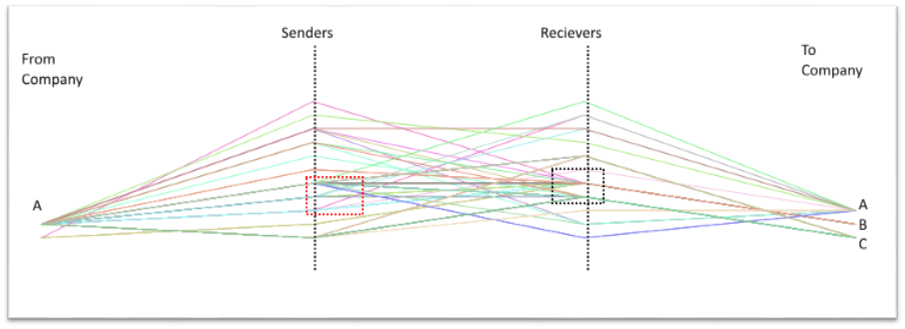
Below are a sample of some the graphs I encountered, the below chart we created using the spatial datatype within MS SQL Server.
If you look at the below graph you will see that company A has a number of employees sending emails but the employees within the red box tend to cc a large number of additional people most of whom are within the company A itself. You will also notice that mails from most A employees are focused around mainly two emails accounts as shown within the black box.
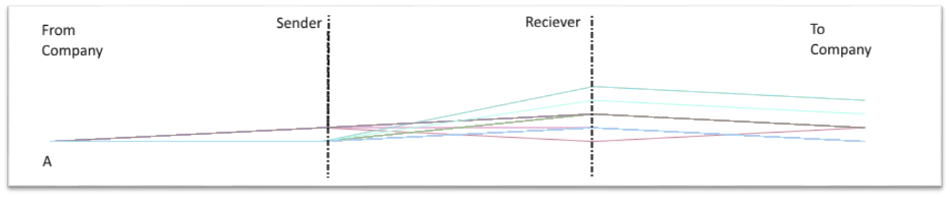
In the below example you will see the source company is very small and typically send out mails to a number of different destinations, it is fair to say there are fewer decision makers in the below company compared the above example.
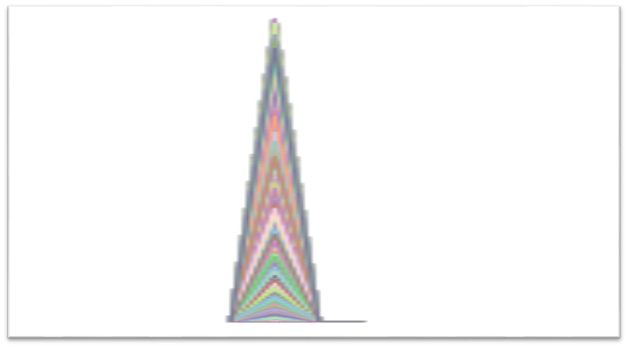
In the below example you will see there is one company, using a host of different emails ids to send emails to a single destination, this is an example from the job portal Naukri.com from whom I keep getting invitations to interview every day. This is also how most spam mail accounts look for example Airtel Network graph also looks very similar.
There are some interesting graph regarding my social media accounts as well but that I am still analyzing. So now comes the really interesting part.
After extracting the data for all the emails that have been sent back and forth over the last 5 years the next problem I faced was how to visualize it. Now SSRS is a great tool but unfortunately it falls short on the kind of reports being generated today. I then explored PowerBI and found out that it doesn’t have any charting functionality for Network graphs and neither did Excel. This left me with a choice of downloading and using some tools developed by third party companies. The project I am working on is for personal use and therefore it didn’t seem worthwhile to purchase or install anything permanent so as always I resorted to writing my own code to achieve the results.
The core of the logic is shown below
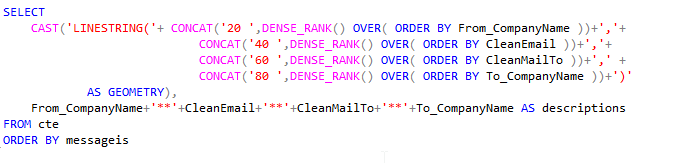
I used dense rank to create a set of points in space. As you can see on the y axis at intervals of 20 units I plot the different parts of my network e.g at 20 a plot the unique companies. So Company A gets a plot of (20 ,1) Company B gets a plot of (20 ,2 ) , at 40 I plot From Addresses etc. This process of repeated for each vertex and then I use Linestring to create the edge between these vertices. I will admit it’s not pretty but it does provide a similar kind of visual representation as offered by SSAS data mining chart and that was all I was looking for. While I don’t normally recommend doing visualization within SQL Server Database engine I really think it’s awesome that there are options available for those in a fix.
The above example can easily be extended to perform a number of additional analysis such as traffic patterns, spread of epidemics, choke points in manufacturing processes, social networks etc. Hope you found this post useful and looking forward to hearing any other scenarios you think it could be used for.
PS: – If you use rank instead of dense_rank the separation between points gives an indication of the volume of interactions as well. However this can make your graph much larger and as a result difficult to read.
Here is another really good chart conveying a lot of information in a very clean way.
Please Consider Subscribing