Most of the time there will be a relationship between different attributes in the dimension. We saw an example of this kind when we created the date dimension in the previous post. In particular this kind of relationship was a parent child relationship or a hierarchy between Years to Month to Week to Day. Such relationships exist in many different scenarios in day to day business cases. Another example of such a relationship would be between the product category to sub category and then to product items or between a country to state to city to address.
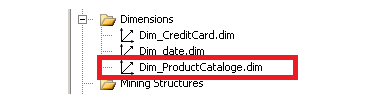
In our cube let us now add a few additional tables and generate a product hierarchy which we can use to identity sales by product groups.
First we need to import the new tables that contain the product relationship into our cube. We see that there are mainly three tables we are interested in.
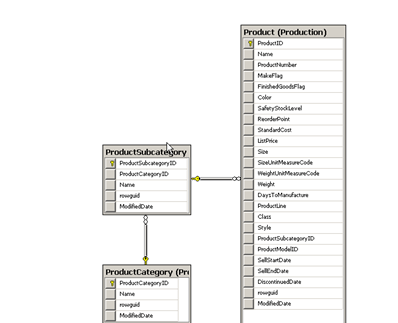
This is because our cube focuses mainly on sales data so we do not need a lot of product information that would be available in say for example a product inventory cube.
As we can see there are three different tables here so let us now de-normalize these tables by creating a named query.
SELECT pc.Name AS CategoryName
	,psc.Name AS SubCategoryName
	,p.Name AS ProductName
	,p.color
	,p.ProductID
FROM [Production].[ProductCategory] pc
JOIN [Production].[ProductSubcategory] psc ON pc.ProductCategoryID = psc.ProductCategoryID
JOIN [Production].[Product] p ON psc.ProductSubcategoryID = p.ProductSubcategoryID
Notice that we have included only the productid as the key column since this is the column with which we can link to the measure group tale called sales order details.
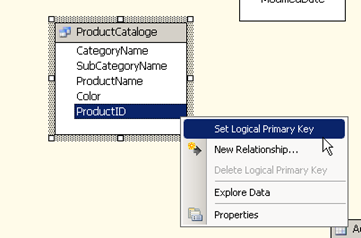
In the below screen shot we have created the named query and now assign the productid as the logical primary key. Please refer the post on creating named queries to see how we reached till here.
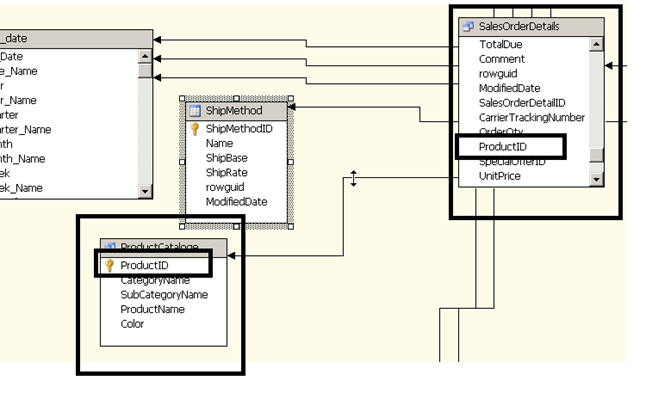
Once the primary keep is setup we establish the relationship between the fact table and the product catalogue by selecting the productid from the fact table (salesOrderDetails) and dragging and dropping the column into productid column in the ProductCataloge table.
Save the data source view. Next we create the dimension using the new object that’s been added to the Datasource view.
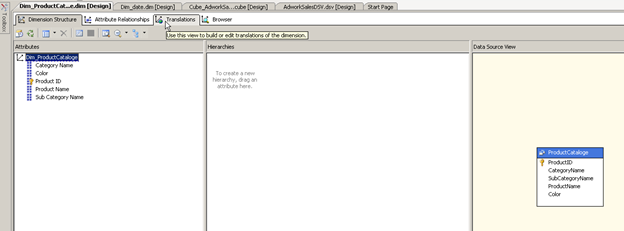
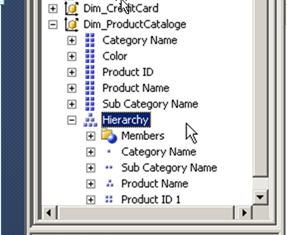
Please refer the post on how to create the dimension in order to reach this step. When we explore the dimension we see that while there is a relationship between the category , subcategory and the product name there is non-defined in the Hierarchies pane in the middle of the screen.
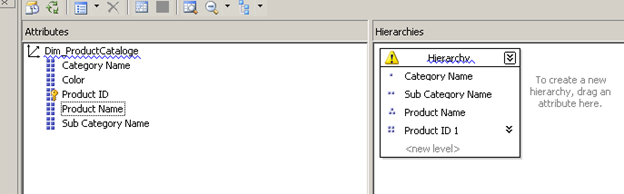
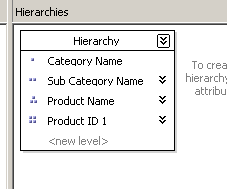
Let us now define this hierarchy. We do this by dragging and dropping the different attributes into the middle pane , as you can see the highest grouping ( category in this case ) comes first and then we add the next sub groups etc. until we reach the primary key column. At this point we are presented with a warning.

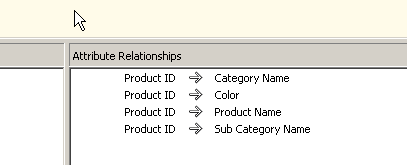
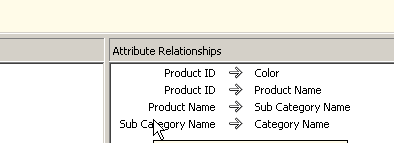
Since there is no relationship defined we need to do them now to ensure we get the best performance. We can do this by navigating the to Attribute Relationships tab on the top half of the dimension editor window. The below screen shows us the different attributes are related to the key column instead of each other. Let us correct this now.
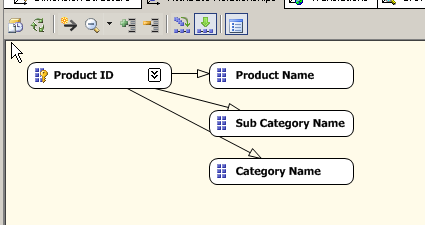
From the above screenshot we can see that the relationship between the ProductId to the Product Name is correct so now we need to map the product Name to the productsubcategory as shown below.
 Select the mapping between the productid and the sub category name and right click and choose Edit Attribute relationship. | 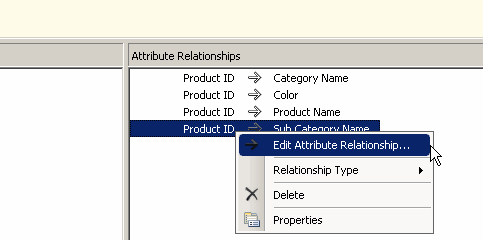 | 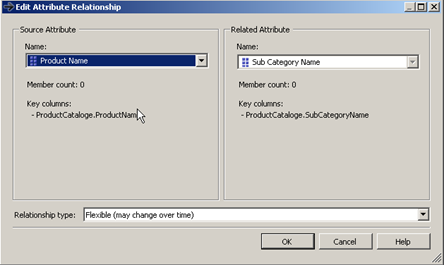 |
In the window that appears on the third column of the above table define the relationship between Productname and Product Subcategory by selecting the ProductName from the left hand side menu. Press OK , repeat the same steps for the mapping between productid and category only this time the relationship is between sub category and the category.
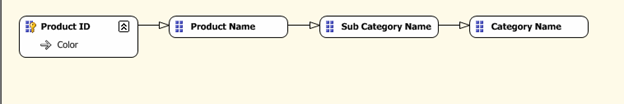
When you’re done the Attribute should look like the screen below.
At this point we see that the blue line from the hierarchy that was defined earlier is gone
We now see there is an additional blue line under the dimension attributes pane
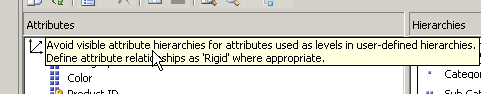
Avoid visible attribute hierarchies for attributes used as levels in user defined hierarchies.
It says we should hide the attribute if it already belongs to a hierarchy. This is only a recommendation and therefore we need to evaluate if there is a requirement to make these changes. A typical example is when viewing the product catalogue do we need to be able to view data at the sub category level without its dependency on the parent (category) or the child (Productid). It’s better to look at this in terms of an example so let us finish this dimension and then come back to see examples of this.
The next step we need to do is to define the key column relationship for the attributes. Earlier we had a unique productid for each product Name, and we had unique Product subcategory for each for sub category and the same for the categories too. However with our current design and relationship defined we see that multiple products can map to the same subcategory so the value of the subcategory will be duplicated many times. We need to correct this so that when we drag and drop a subcategory while browsing the cube it understands that the cube will need to look up the underlying product IDs and then map to the fact table using these product IDs.
We do this by selecting the attribute and then navigating to its properties window.
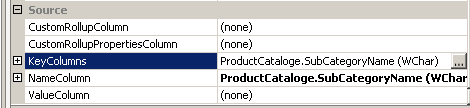
In the properties window you will see the section for source and under source there is an option for Key columns. Click on the Ellipse next to header key columns. In the this example I am configuring the key column for the sub category .
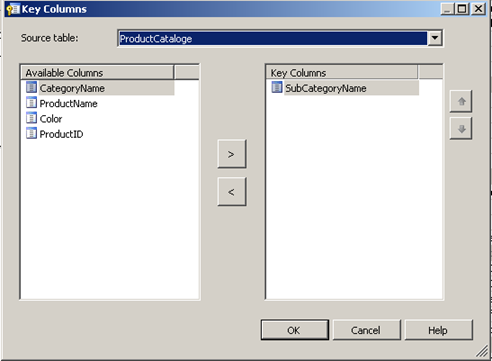
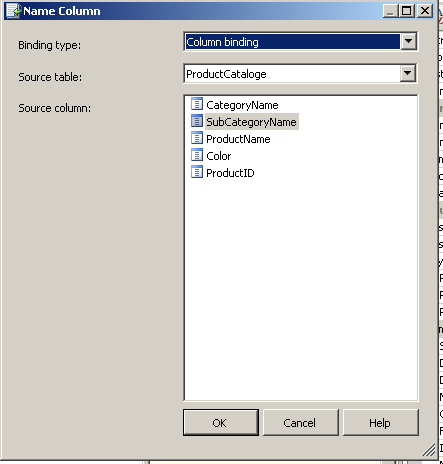
Once the above screen as been setup. Press OK. We now need to define the Name column which in this case is the subcategory attribute so simply select the ellipse and select the subcategory column and press OK.
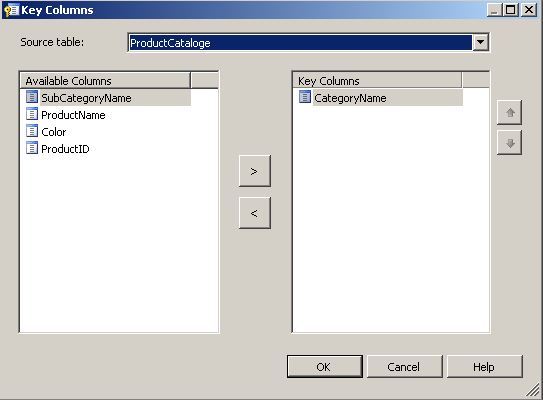
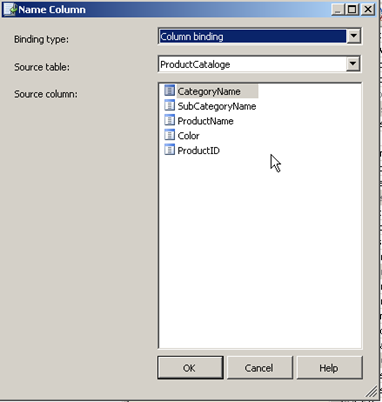
I have included the screenshots for the category below for comparisons.
Save the dimension Dim_productcataloge
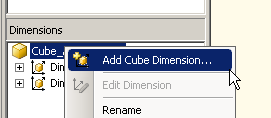
Let us add the newly created dimension to the cube as done in previous posts.
At this point we now need to add a new measure; the measure will be used to identify unique line items in the order. We have already created a measure to count distinct order header id but this measure is not granular enough to identify the sales are the like item level.
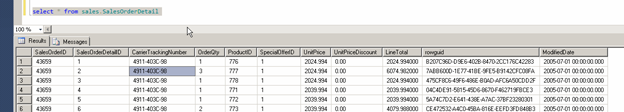
When we query the sales order detail table we see that there is a column called call OrderQty which shows the number of times that order line items was included or purchased as part of the order. Therefore in the below example we see that Sales Order ID 43659 purchased three pieces of the productId 777.
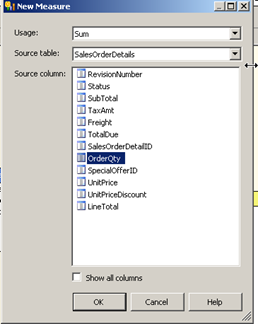
So in our measure groups we are going to sum the values by OrderQty as shown below
If each item will always be billed individually we would have got the same result if we did a count of rows. But the best practise is to use Sum.
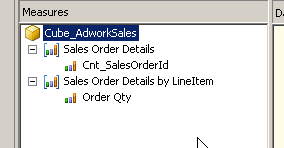
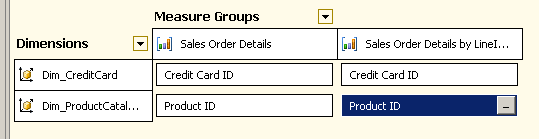
I renamed the measure group to make sure they names are distinct and meaningful.
Now let’s Map the new measure and the dimension to each other. As before the relationship is automatically identified as part of the primary key and foreign key relationship between the two tables.
Save the cube and deploy it and process it.
Browse the cube by connecting to SSMS and drag and drop the hierarchy from the dimension into the rows pane of the screen.
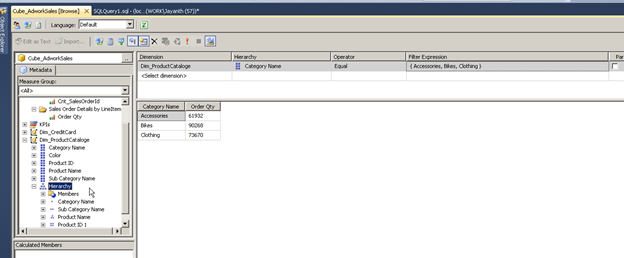
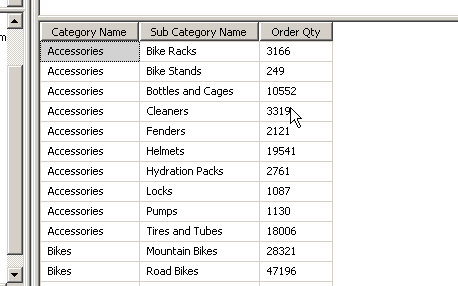
As you can see from the screenshot SSAS automatically understood the relationship and aggregated the data based on the relationship defined by us earlier.
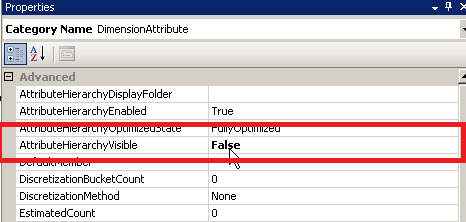
Avoiding visible hierarchies, when we set the property AttributeHierarchyVisible property to False the attribute stops appearing in the dimension pane of the browser. This is because we now have the attribute as part of the hierarchy anyway.
 BEFORE ( VISIBLE ) |  AFTER ( NOT VISIBLE ) |
References
http://technet.microsoft.com/en-us/library/bb630296%28v=sql.100%29.aspx
Please Consider Subscribing