Once the data source and the Datasource view have been created the next step will be to create the actual cube. Within BIDs there is a very useful wizard which allows the developer to create the cube in a few simple steps. However as the cube become more complex developers will see that it’s easier to create the cube from scratch without using the template. In this post we will explore the latter method so that we can explore each step of the process in detail.
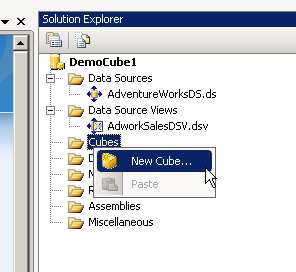
Open the democube project as before and right click the cube folder as shown below
The below wizard will appear.
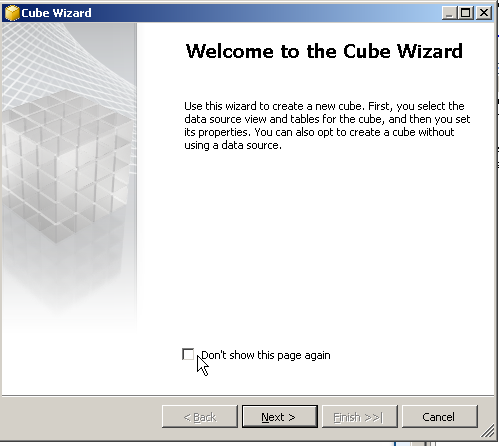
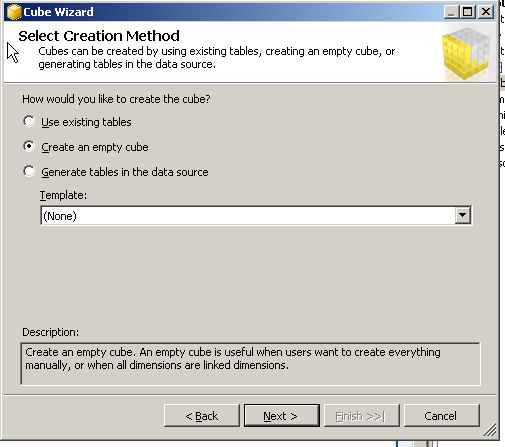
Press Next , in the next screen select Create an empty cube and then press Next
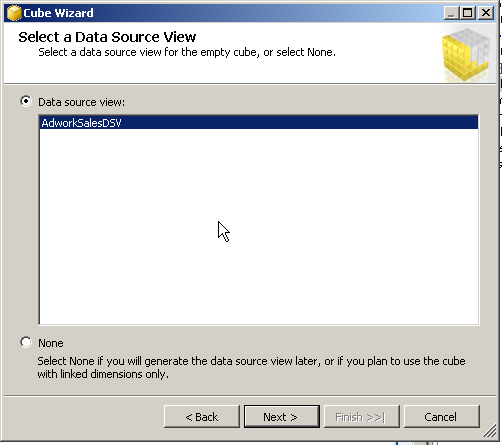
Select the Datasource as required and then press next , as shown in the below screen
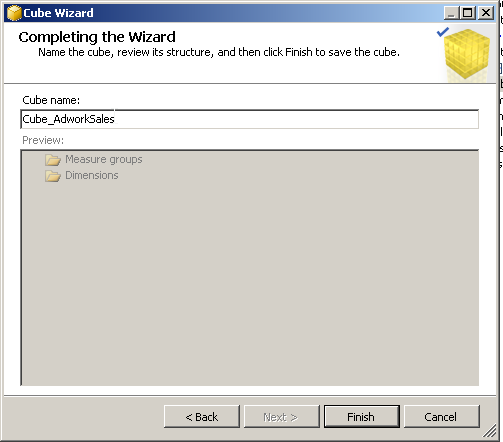
Give the cube a Name and then press Finish
Once the wizard completes you will see the below screen with the basic empty cube
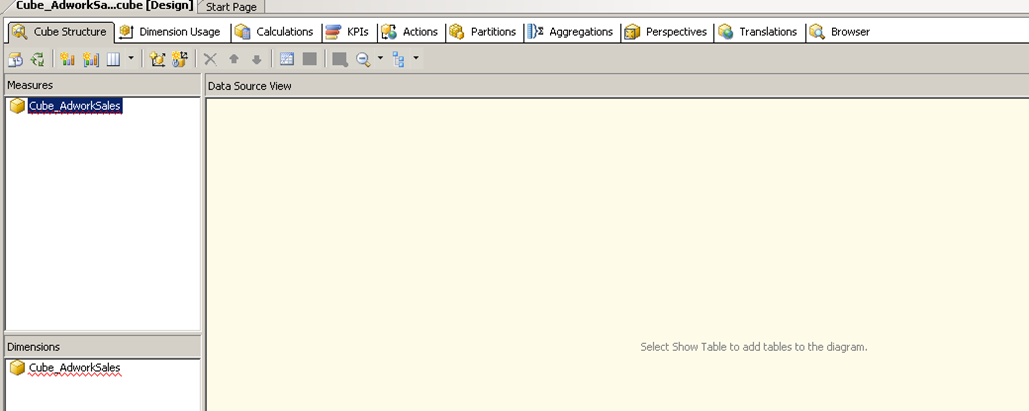
This is the most important screen as far as the development of the cube is concerned. Almost everything we need to do on the cube will be done on this screen using one of the many tabs shown above.
Let us now explore each of the tabs and their purpose.
Cube Structure: – This tab contains and overall representation of the cube including the different measure and dimensions that are used within the cube. The data source view screen within this window will display the list of tables taking part in the cube. It is important to remember at this point that not all table defined in the data source view need to be part of the cube. However a table from the Datasource view needs to be a part of the cube if it needs to be part of a dimension or measure. You can manage most aspects of the dimension and measure from this screen.
Dimension Usage – This tab is where the dimensions get mapped to the facts. The tab contains a matrix of dimensions and facts and key columns which establish relationships between the two. Incorrect mappings in this screen can result in the measures calculations going bad.
Calculations – The calculations tab is where the developer can create his own calculated measures, basically this means that the developer can create measures based in existing facts which are not readily available within the fact itself e.g. running totals etc.
KPIs – Give the developer to summarize data is a different way. Often it is more important to see the data in terms of good, bad ugly rather than the actual numbers , e.g. when viewing a trend over a period of time. In these cases it is better to create and use KPIs which groups data based on the thresholds set by the developer and then shows one among many status outputs.
Actions – The Action tab does exactly that, it performs an action based on the user input. A typical example of using this tab is to drill down data. For example, the initial report might display top sales months for the year. The business might want to drill down further to analyse the products that contributed to the sales for the month. In this case the drill through action can be used and configured from this screen.
Partitions – this is a feature similar to the partition functionality in a normal database engine and while there is no partition function or schema the basic idea is to logically group’s data in the different fact tables so that they can be managed easier. For example a fact table with 1 million rows per year for the last 10 years initially starts as a single 10 million rows single partition. However if its split into 10 partitions of 1 million rows each then processing the cube becomes much easier because historical data is not reprocessed.
Aggregations – as mentioned in some of the previous posts the reason why OLAP cubes are faster when it comes to working with millions of rows is because there are pre aggregated or summarized data available for the most combinations of dimensions and measures. From the above example we can pre summarize the data for the last 9 years and save the results because it is unlikely to change since in most cubes data is not retrospectively updated beyond a few months.
Perspectives – These are similar to views that are created to simply the underlying normalized structure in the traditional database. A enterprise cube can be massive and as a result there could be 100s or thousands of dimensions attributes and measures. This can be daunting for the business user who is probably looking for only a small subset of the data and doesn’t need to view the cube in its entirety. Here the developer can create subsets for the cube called a Perspective and assign permissions as required to make sure the user gets just enough information to be able to do the job and not get overloaded with information.
Translations – An enterprise cube needs to be able to cater to multiple department and locations or office located around the world. As a result it becomes important to display information to the business user in their native languages in order to make adoption of the cube easier within the organization. This can be achieved via this screen.
Browser – Once a cube has been designed, deployed and processed the developer can use the browser screen to validate the aggregations and make sure the cube is returning the desired results.
Please Consider Subscribing