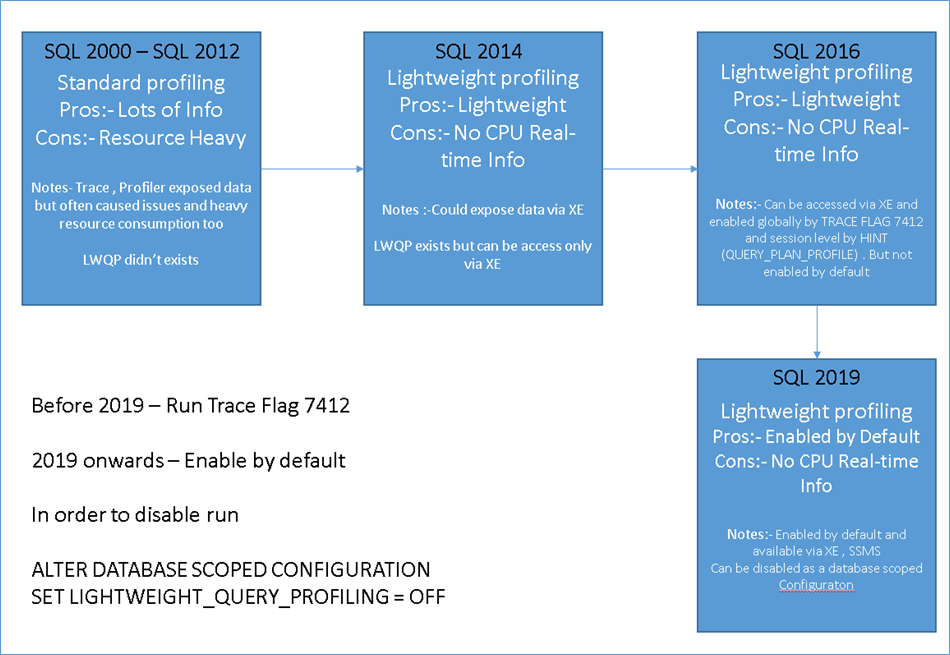
Lightweight query profiling is a feature that was introduced in SQL 2014. Before we can start talking about lightweight query profiling we need to understand the problem that it was solving. Prior to the introduction of lightweight query profiling database administrators had to rely on profile or running a trace in order to identify performance issues. SQL profile and server side trace while providing a lot of information also required significant resources of their own in order to collect information and often would result in performance issues of their own. As an alternative to running a Trace light weight query profiling was introduced because of the seemingly less amount of resources it would require. As Extended Event became a preferred method for capturing real-time performance characteristics of queries Microsoft have been fine tuning the mechanism with each release until SQL 2019 where it’s enabled by default.
When it was first introduced the feature was only available as an extended event subsequently in SQL 2016 the feature could be enabled by setting a trace flag or by clicking the button include live query stats in management studio. With effect from SQL 2019 this feature is now enabled by default and can be disabled by running a TSQL command as a database scoped configuration.
ALTER DATABASE SCOPED CONFIGURATION
SET LIGHTWEIGHT_QUERY_PROFILING = OFF
So does this mean that going forward lightweight query profiling is the only thing that DBA is would require? No.
Keep in mind that the way it achieves “Lightweight “query profiling is by neglecting certain CPU information at runtime. So in effect it is actually capturing what would be considered the most relevant and important information during run time for the majority of the cases but not all. In other words there are some information that you would only find in the standard profile and not within the other. The Microsoft documentation mentions CPU bound servers would continue to require standard profiling in order to identify the correct root cause. From SQL 2019 onwards we now have lightweight query profiling enable by default and we also have the query hint that can be used to identify issues at the session level as well. Primarily you would still use extended events in order to capture details both from the standard profile and from lightweight query profile.
Below is the syntax for using the query hint
SELECT *
FROM Application.People
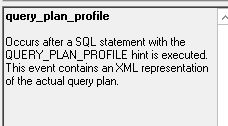
OPTION (USE HINT('Query_plan_profile'))
Keep in mind
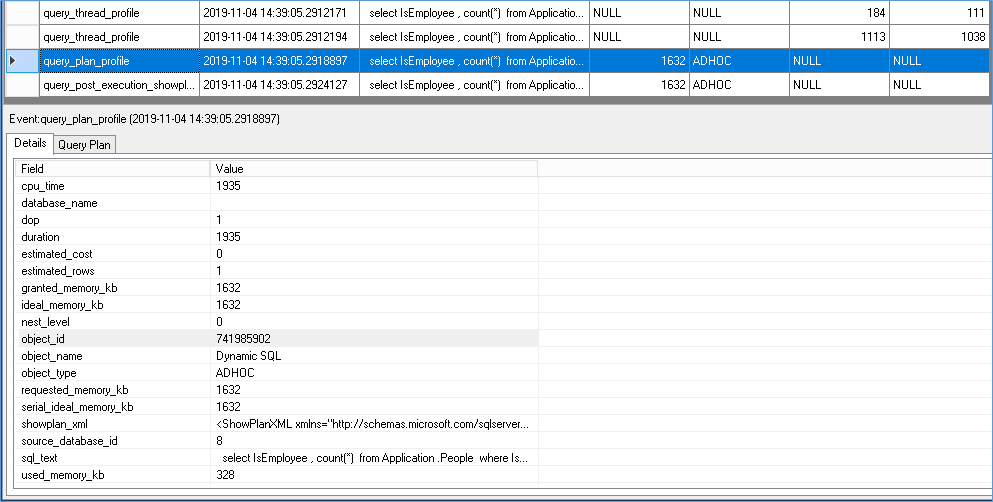
- If your extended event is already running the below event query_post_execution_showplan then you will default to standard profile for all cases
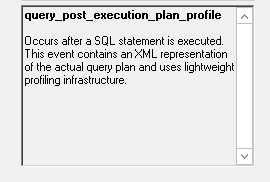
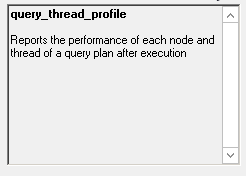
- If your extended event is already running the below event query_thread_profile then you will default to light weight profile for all cases
- If your extended event is already running the below event query_plan_profile then you will capture details only for queries that are running with the hint.
So in the real world you need to follow the order 3, 2, 1
Here is some clarity as the event is defined in the Extended Event
CASE 1
Lightweight
Only for queries with HINT
CASE 2
Lightweight
Actual execution plan
CASE 3
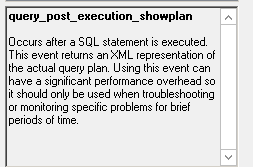
Standard
Actual Execution plan
CASE 4
Lightweight
All Queries
Notice how query_plan_profile and query_post_execution_showplan have additional data not available to query_thread_profile. Most notable the execution plan.
Please Consider Subscribing