I am a bit confused about this feature so I thought I would post about it to get feedback on its usage in SQL 2016. With SQL 2016 there is a feature called Live Query Stats being introduced. As its name suggests it provides details on the actual tasks being executed in real time. What needs to be kept in mind is that previously we had the Estimated (before) and Actual (after) execution plan. With this feature we get the Current execution plan we get to see the order and the progress of the tasks within the plan as they are being executed.
The most useful details are provided when you run
SET STATISTICS PROFILE ON
Before viewing the Live Query stats
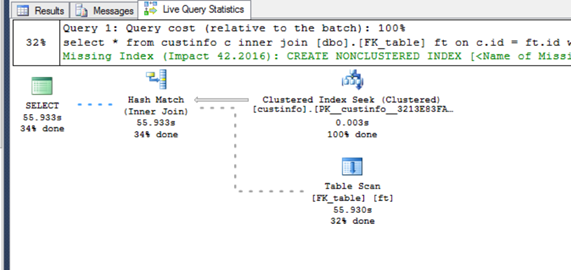
SET STATISTICS PROFILE ON – notice the % done values under each task and the time in sec |
|
The feature is only really useful for long running queries since smaller queries finish before the UI can actually display the animation. Also the feature does degrade the performance a bit. You can view the live execution plans from within activity monitor for long running queries. One of the way I see this being used is by L1 DBA looking to kill long running queries that are consuming system resources. You can now check how far along the query is before deciding to kill the query.
Is there any other use you can think of for this feature that you couldn’t do before?
Please Consider Subscribing