Percentile is a great way to find distribution of data across your range of values. It give a great feel for how the data is distributed and is especially useful for analysis over demographics etc. Percentile is an indication of how what is the upper bound for the value at a particular percentile value. Consider the data below
1,1,1,3,4,5,6
If you look at the above series you can see that at 50th percentile the value is 3 because values that are equal to below three can be found at the 50th Percentile
Let’s look at another example as shown by the screenshot below
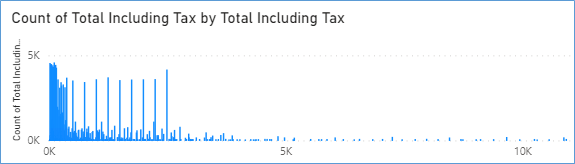
If you look at the above chart we can see the overwhelming number of rows are clumped towards the beginning of the chart. This is evidenced by the table below.
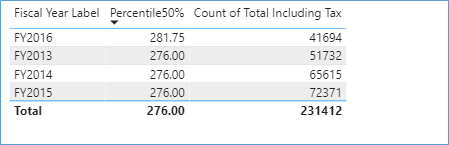
We can see from the above table that 50% of the values for each year fall below 281.75 or 276.00 so while we may have products being sold for anywhere between 1 to 100000 Dollars. 50% of our products are priced below 281 $.
The formula for calculating percentile is shown below
Percentile50% = PERCENTILE.EXC('Fact Order'[Total Including Tax],.5)The SQL Equivalent of the function would be similar to
SELECT *
FROM (
	    SELECT ntile(2) OVER ( ORDER BY [order key] ) AS Tile
	,*     FROM fact.[Order]
	) a
WHERE tile = 1
Please Consider Subscribing