Often in Business Intelligence developers are required to create Measures based on time series analytics like compare this year sales with last years. In such cases you can use the Parallel Period Measure to aggregate the data based on dates in the calendar. This is especially useful when trying to identify trends such as increase in the number of cases, sales, orders etc.
There are some prerequisites that need to be fulfilled before time series analytics can be performed. Details are available at the end of the post.
Let us look at the example below. The table shows the OrderQty for the current year as well as the OrderQty for the previous year.
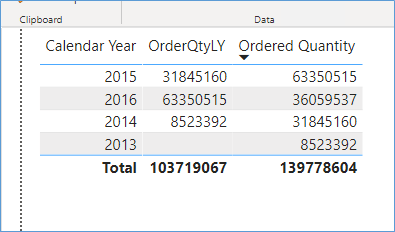
By having access to the data in this way you can now perform calculations such as % change. Notice however what happens when we try to view the data on a month on month basis.
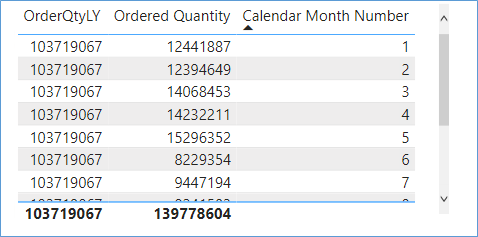
This is because in parallel period we have to manually define the period for which we want the aggregate to be performed. As a result it only has data for aggregations for the previous year as shown by the way we wrote the formula.

As you can see the parallel period function isn’t useful on its own and has to be combined with some aggregate function.
The SQL Equivalent would be similar to the query below
WITH cte
AS (
     SELECT d.[Calendar Year] AS year
 ,sum(Quantity) AS Amt     FROM Fact.[Order] o     INNER JOIN dimension.[Date] d ON o.[Order Date Key] = d.DATE     GROUP BY d.[Calendar Year]
 )
SELECT Amt
 ,year
 ,lag(Amt, 1) OVER (        ORDER BY year         )
FROM cte
ORDER BY year
Prerequisites for Time Series Calculations in PowerBI DAX
Please Consider Subscribing