PowerBI is one of the products where Microsoft aggressively releases features every month. The effort is paying off as it’s quickly become the industry standard for reporting. The most attractive aspect for most companies is the comparable visualizations at a very attractive price point.
In this series of posts we cover the new features released by the PowerBI Team and how you can use them in your own reports.
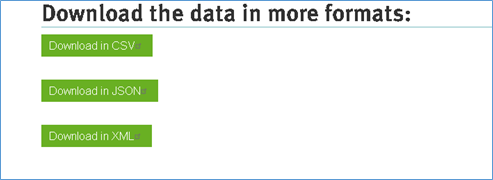
For this series we are going to use the CoVid -19 (corona) dataset available in the link below since we feel it is a dataset most people understand and relate to by now. Scroll down the page till you see the download link.
We are using the April 2020 release of PowerBI for all features in this series, if there is a change it will be called out at a later point.
Importing data into PowerBI
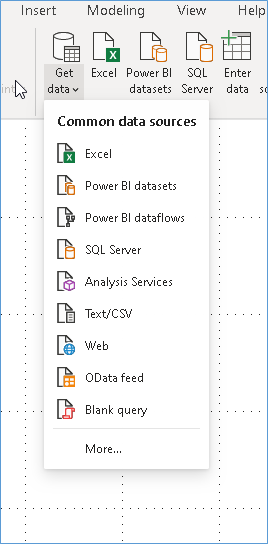
Once the CSV file has been downloaded we can import the data using the Get Data wizard in PowerBI. Navigate to the top bar and look for get data. In the drop down list look for text\CSV and select it.
Go to the location where you have downloaded the file and select the file press open.
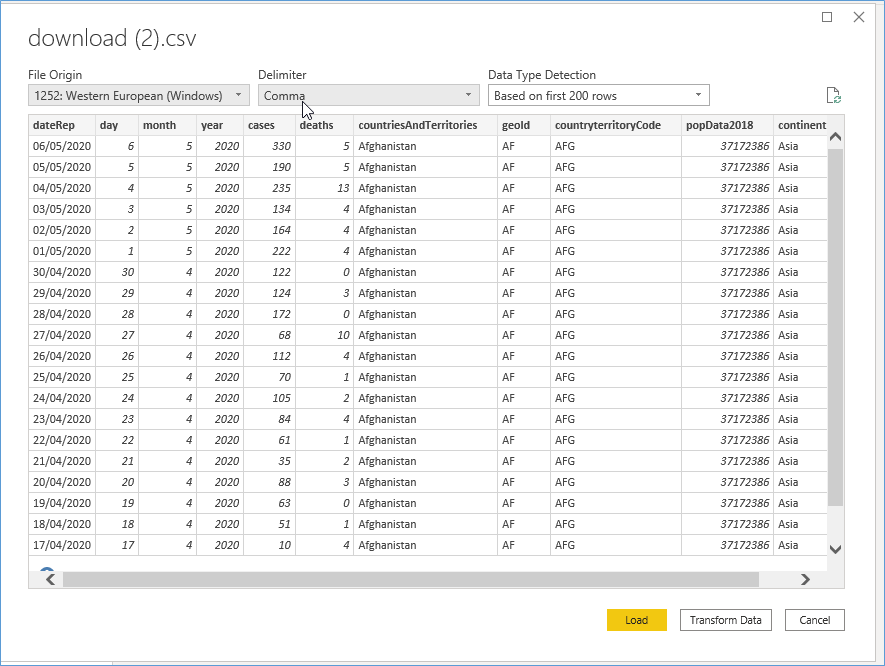
Once the data is loaded you should be able to see the screen above. Click load in order to input the data into PowerBI.
Enabling Preview Features
Some posts use a preview feature .In order to enable this preview features you need to go to Options and Settings
Download Links
Please Consider Subscribing