In this post I cover the use of the new vector datatype in SQL 2025. I’ve noticed that a lot of RDBMS database folks seem to struggle to grasp the concept of Vectors. This is not a new phenomenon and baffles me sometimes. When Geometry and Geography datatype was introduced, I expected mass adoption but I’ve only seen one implementation where it was used as part of the core design. Same goes for Hierarchy in SQL Server, (yeah remember that?) or Graphs tables. With an org chart guaranteed in every company it still didn’t make any impact. More often than not SQL comes out with a new datatype every release and developers are slow to adopt it. I feel this is because the datatypes have become more niche datatypes. Except for say JSON and XML with mixed results.
The aim of this post is to over simply what a vector is and then explain why its important for us to understand it. Try and remember that there is a lot more to the datatype than I can explain here so you need to do some follow up later on.
What is a Vector
A vector is simply a collection of numbers. It is represented as a comma-delimited list in square brackets e.g.
[1,2,3,4,5]
Actually, that is way too over simplified
A vector is simply a collection of meaningful numbers. It is represented as a common delimited list in square brackets.
Wait meaningful in what way?
That’s up to you. You can define the meaning in anyway you see fit. Take for example the name below.
Jayanth = [7]
The vector for the above word is a collection of 1 number representing the length of the word. This is a one-dimensional vector. Because there is only one number. Let’s expand on the above example.
Jayanth = [7, 2]
The above vector is the collection of 2 numbers (2-dimensional vector) where the first number represents the length and the second the number of vowels in the word.
Just to drive the point home, let’s take it one step further
Jayanth = [7,2,1]
The above vector is the collection of 3 numbers (3-dimensional vector) where the first number represents the length, the second the number of vowels and the third an enumerated value to identify if it’s a noun. 1= noun, 2= verb etc.
As you can see the numbers have to be meaningful and what the meaning is, is up to you. This poses a problem for us because ChatGPT might use [123,124,1231] to define a cat and Gemini might use [98123,98967,765123,089123] to identify a cat. So, once you commit to a particular way of vectorizing the string you are pretty much stuck with it. Also notice how ChatGPT has 3 dimensions for cat and Gemini has 4. This is an issue for us because the number of dimensions matter to us when defining the datatype. But we are getting ahead of ourself.
Without knowing it you are already using a variation of vector representations already.
Who decides the number being used as a Vector?
For example, the below vector [12.971599,77.594566] is the GPS location for Bangalore. It’s a meaningful number used to represent the city on the Map. The fewer dimensions a vector has the less information it has (which is fine depending on the nature of the data). Notice I didn’t say less precise. For example, the previous vectors identify Bangalore to high accuracy on a 2-D plane but tells us nothing about the elevation of the city above MSL. Maybe it could be [12.971599,77.594566, 920.0000] to indicate the altitude of the city. But then it doesn’t tell us which country it belongs to so [[12.971599,77.594566,920.00000,91,080] could be added to indicate the country code and the area code for the city. As you can see by now; pretty much anything can be represented by a meaningful set of numbers. The choice of Number is decided by the algorithm that trained the LLM (the Model).
But why use a model
I could totally follow the way vectors were built just now. Why not use the same? The short answer is because humans are not capable of doing this at scale. As you saw earlier the more dimensions we have the more info we have. It’s not uncommon to have 1000+ dimensions to define content. Hence the LLM goes over all the data and find a way to create vectors so that related vectors (dog and dwag are similar but not related dog and cat are not similar but related) are close to each other.
So, we know that using more dimensions yields better results. The next thing we should talk about is the accuracy. In a very mathematical sense, it’s the number of decimal places in the number. The more the decimal places the better the accuracy. Why decimal places (because GPUs are really good at adding and subtracting floating point number as opposed to CPUs). Naturally like a GPS coordinate the less decimal places the less precise the data. This is not always a bad thing. More decimal places mean more volume of data and subsequently a larger model. It’s common to quantize data to reduce the size of the model in memory. Quantize in an oversimplified way is simply conversion of a number from float to Int say from 32 bytes to 8 bytes.
Why use vectors in the first place?
If all we needed were numbers, there are so many other ways we could represent them why bother storing the number as a vector? This comes down to the way the vectors are used in calculations. Mathematically it’s a Matrix multiplication but in the interest of oversimplification I am going to use the diagram below to try and convey the point better.
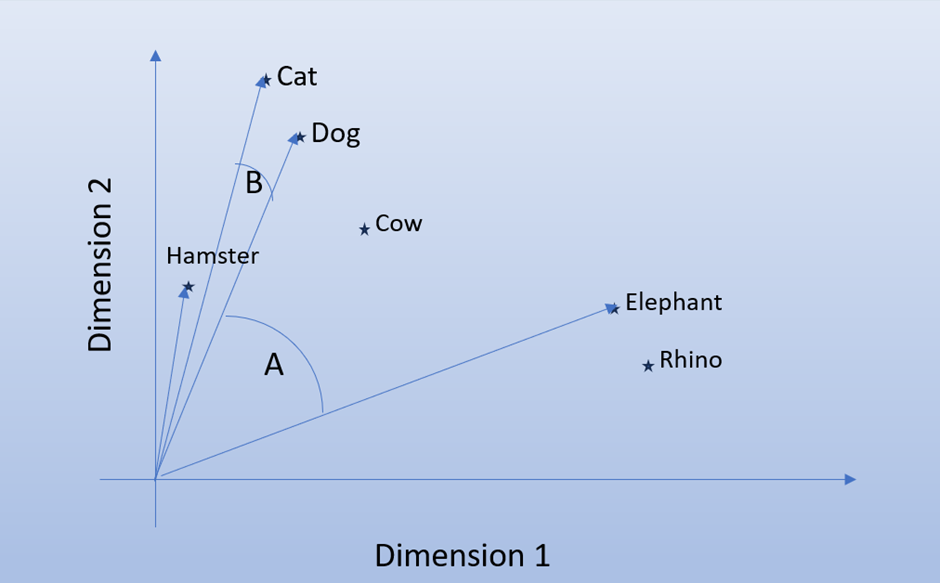
Observe the diagram below, assume we passed a number of animals into a LLM and asked it to generate the Vectors. The vector is 2 dimensional so that I can plot its position on a 2-D graph. Notice how Cat and Dog are closer than Hamster but they are grouped closer because they are pets. Notice how Cow is not a pet but a domestic animal so it’s not grouped with pets but neither with wild animals (the fact that we have tamed elephants makes the point a bit ambiguous but you get the general idea).
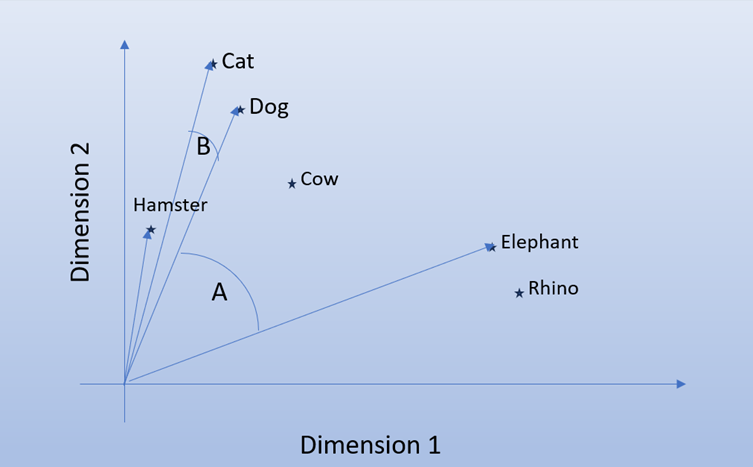
If you look closely at the chart, you will find that in terms of distance Cow is closer to Dog than Hamster. Obviously, we don’t want to show pictures of cows when people are looking for pets so we can’t use distance as a measure of how close two vectors are. Instead, we use the angle specifically the Cosine Similarity angle. It doesn’t matter if hamster if further than Cow in the chart. The angle it makes with Dog will be small therefore indicating it is related. This is more complicated in 3D so just imagine how much more complicated it will be for a 1000-dimension vector. The value for Cosine similarity moves between 1 (perfect match) to -1 in opposite directions.
In case the LLM provides a set of vectors that literally place related items closer to each other we can also use Euclidian distance measurement. In a simple way we are measuring the shortest distance between the two points on a plane. Euclidean Geometry refers to coordinates in a plane. Curved geometry vs flat. Think Einstein’s gravity vs Newton.
Time to put it in SQL Server
With all the buzz around LLMs it is no surprise Microsoft rushed to implement Vector search in SQL Server. The idea being that you can create vectors for important documents in your organization and have the data saved inside SQL Server. This data can then be easily searched within TSQL to build Retrieval Augmented Generation. Imagine a chat bot that answers user questions by getting a prompt from the client and then identifying the most relevant help document/FAQ for the ticket.
As a datatype the format is very similar to text datatypes, you have the name of the datatype and the length (which in this case is the no of dimensions)
MyVectorColumn vector(1000)
The important thing to keep in mind here is that if the number of dimensions is 1000 then every row in the column much have 1000 dimensions. You cannot store vectors from different LLMs in the same column. In other words, every embedding created by one provider needs its own column. ChatGPT embeddings will need its own column and will be Gork
Even if there are two different LLMs using 1000 Dimension embedding by coincidence the data cannot be saved in the same column as it will affect the searchability of the data. For example, you can have Lat, Long and Alt as 3 dimensions for a position and you can also store the checksum values of the “What 3 words” for that position. Doesn’t mean they are the same thing.
Continuing with the graph earlier let’s try to represent the data inside a SQL Server table.
Let’s create the table and insert some dummy data into the table, don’t worry about the value for the vectors they were generated as an example and do not reflect the actual values. The important of the values will become clear later on.
CREATE TABLE Vectors (
	id INT identity(1, 1)
	,AnimalName VARCHAR(1000)
	,VectorDef Vector(3)
	)

INSERT INTO Vectors (
	AnimalName
	,VectorDef
	)
SELECT 'Cat'
	,'[1,2,3]'

UNION ALL

SELECT 'Dog'
	,'[1,2,6]'

UNION ALL

SELECT 'Hamster'
	,'[1,1,1]'

UNION ALL

SELECT 'Cow'
	,'[50,2,1]'

UNION ALL

SELECT 'Elephant'
	,'[100,2,3]'

UNION ALL

SELECT 'Rhino'
	,'[100,1,4]'
VECTOR Functions
Vector functions are built-in functions in SQL Server that perform the necessary calculations to help determine if any two vectors are close enough to be related. As mentioned earlier we need to perform calculations to find the angle between two vectors or the distance between them etc.
VECTOR_DISTANCE(metric, source_vector,destination_vector)
Metric here means either
- Cosine similarity – used for case similar words have small angles but can have very different magnitudes
- Euclidean distance – used for cases where the magnitude is a better indicator of similarity.
- Dot product – used when both magnitude and angle of all vectors contain information that is relevant.
We already covered Cosine Similarity and Euclidean distance earlier. Dot Product is slightly more nuanced. Cosine gives similarity only based on angle and Euclidean based on Magnitude. Dot product is a matrix multiplication so the value is a combination of the product of the angle and the magnitude. In TSQL the dot product is actually negative so its more of a measure of how dissimilar the two vectors are. This would capture info like cat and dog are mortal enemies or like hot and cold. Textually similar but different meanings.
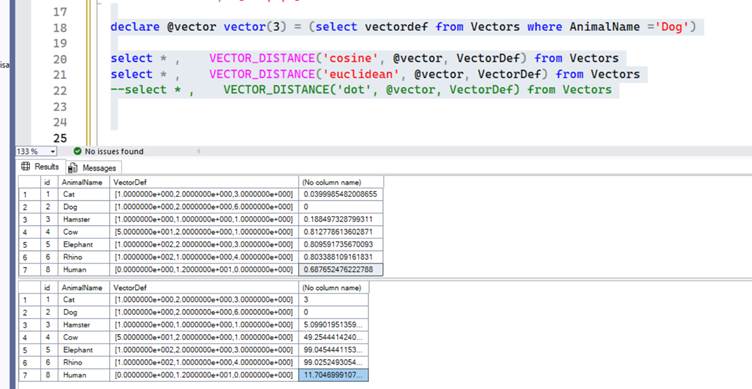
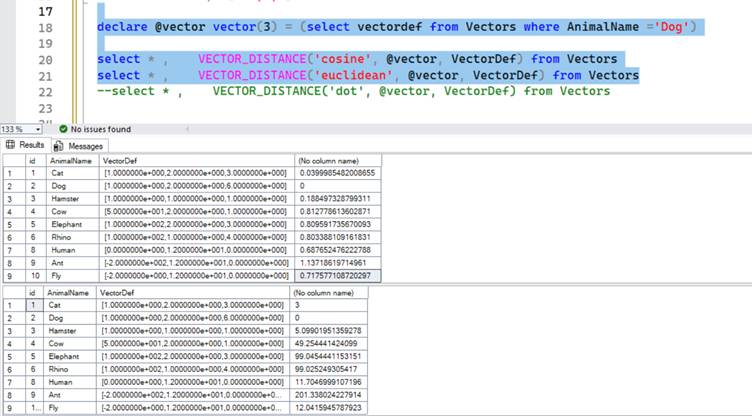
Let’s measure the distance between the vectors in the above table when compared to vectors for the animal ‘Dog’. The below screenshot shows the difference in distance between the different animals; it will be helpful to remember the chart from the previous section.
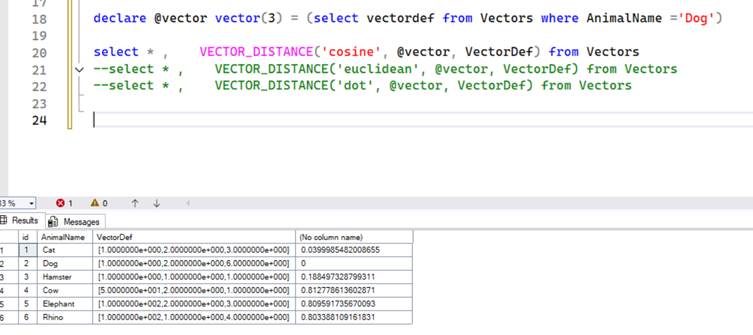
Notice how Dog to Dog distance is 0, Dog to Cat is 0.03 and Dog to Hamster is 0.188 showing that smaller number of better when using Cosine Similarity to measure the distance between 2 vectors. Typically, anything higher than 0.3 indicates it’s not a good match (in my experience).
How does the same data look in Euclidean distance. In the below screenshot you can see that the result is similar to Cosine Similarity but this is not always the case. Remember the numbers come from the algorithm used to generate the vectors. Unlike cosine similarity the numbers are not limited to 0 to 2 scale and can go up to infinity since it is measuring the distance.
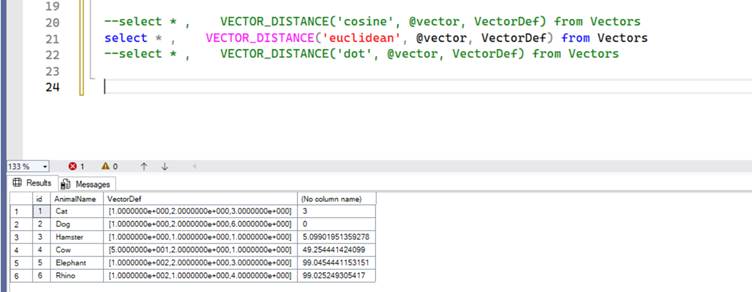
Which method is used to measure the distance depends on where and how the Vectors were created.
What if I want to add a new animal but it has only 2 dimensions ?
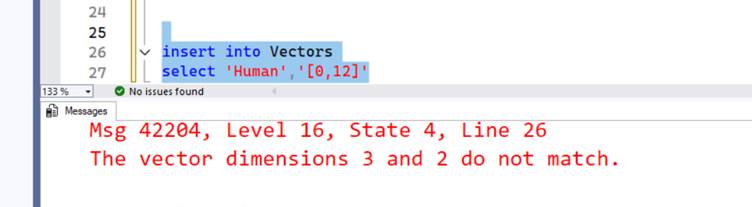
Let’s try to insert Human as an entry into the table, assume the vectors you got for Human are [0,12]. When we try to insert this into the table Vectors, we get the below error.
“The Vector dimensions 3 and 2 do not match”
This is important since we get stuck with the dimensions we defined at the time the column was created. In order to proceed with inserting the data we can pad zeros to add as many additional dimensions.
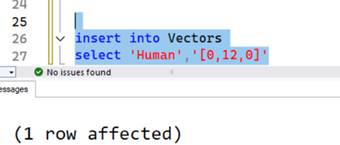
But won’t this affect the way distance is calculated?
Yes, it will. Let’s look at the example below. In this case it shows Humans are closer to Pets than farm animals and Wild Animals.
Let’s add Ant to the list and see the results, notice how far Ant is from the rest of the Animal.
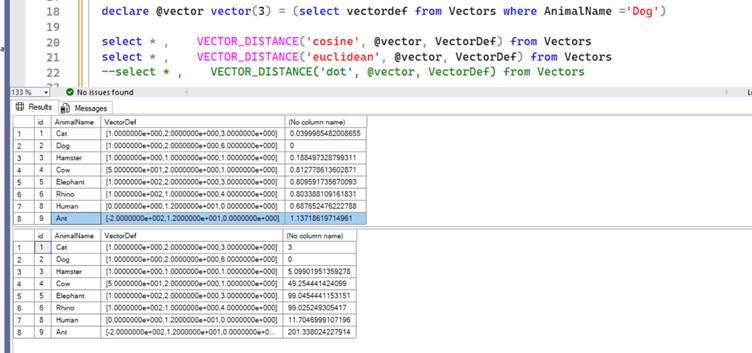
Is this because I made the vector for Ants [-200,12,0]? Yes; vectors can have negative numbers. What if I add fly [-2,12,0] to the list.
Notice how according to distance Fly is closer to cat and dog than to ant. Basically, this should demonstrate that the ordinal position (first value) of the dimension within the vector is just as important has its magnitude (-2). This would seem obvious when we remember that distance has a direction component to it. The distance between London and Paris will differ wildly depending on whether you decide to start off towards the West vs East.
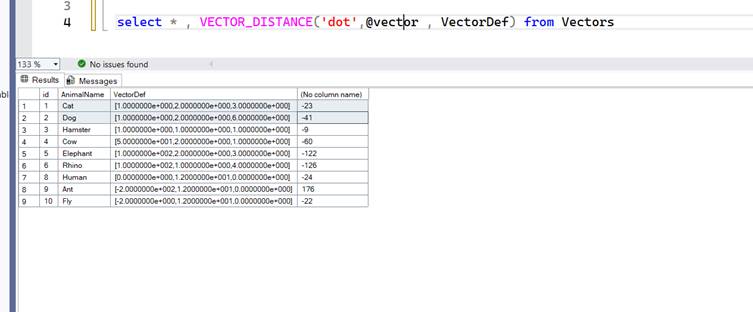
When using dot product, the results look wildly inconsistent but this is mostly because I used fake numbers to represent the vectors.
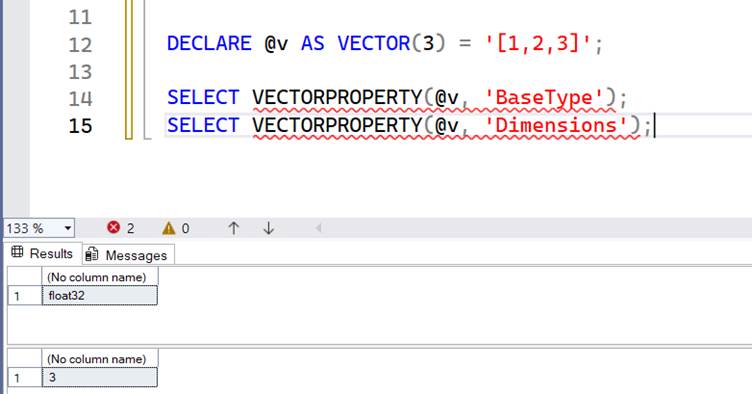
VECTORPROPERTY
VECTORPROPERTY(vector, property) the property tells you the number of dimensions in the vector and the underlying datatype. This is information you would already know unless you get raw data and want to do validation before inserting the value into your Vector column. Its irritating they forget the Underscore between Vector and Property.
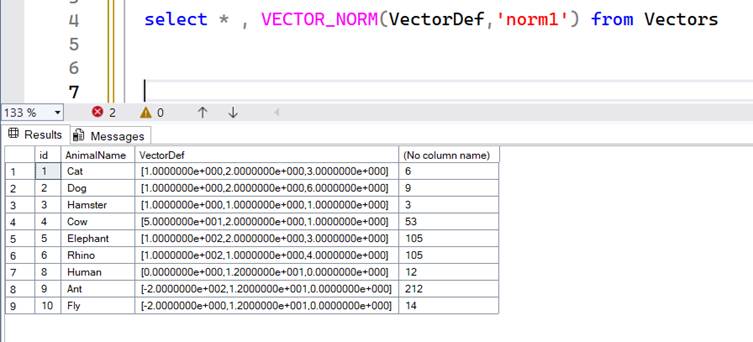
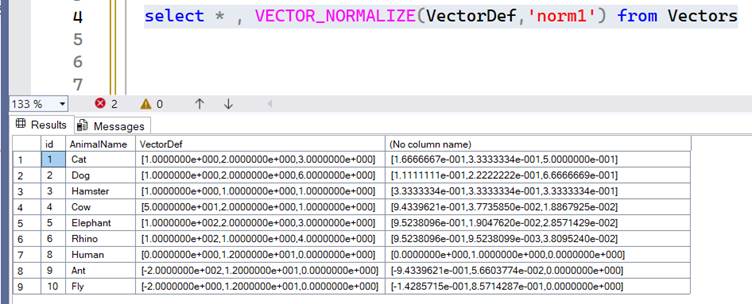
VECTOR_NORM and VECTOR_NORMALIZE
VECTOR_NORM ( vector, norm_type )
A distance is measured between 2 vectors as we have discussed already. A norm measures the distance of a single vector from the origin. It simply adds the |A| magnitudes. So -200 becomes 200 and added with all the other positive vectors to give a straight line from the 0,0 position.
The below diagram shows how root(3^2 + 4^2)= 5 ( Pythagoras anyone).
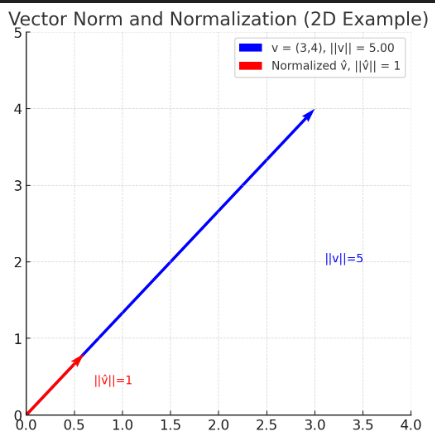
There are different variations of how you can calculate the norm so play around with the options.
The norm returns a value that can be any number. Often this isn’t helpful so we want normalize the vector. Normalize the vector basically rebalances the vector on a scale of 0 to 1. A good way to understand this is if you are trying to buy a car and there are two metrics of equal importance to you. The price and the BHP, the price can go into tens of thousands and the BHP can go to the few hundreds. Since both have equal weightage for your decision it makes sense to rebalance the price and the BHP on a scale of 0 to 1 so that the highest values have a normalized value of 1 and the lowest a 0. This way your difference in magnitude doesn’t skew the data.
Here is what the output will look like
VECTOR_SEARCH
If you have read everything above this heading VECTOR_SEARCH become intuitive and shows you quite simply the vector distance between two vectors limited to N number of results. This function is still in preview and the examples in the BOL don’t seem to be working but you can easily create the behaviours using VECTOR_DISTANCE and TOP Keyword.
DECLARE @qv VECTOR (1536) = AI_GENERATE_EMBEDDING(N'Pink Floyd music style' USE MODEL Ada2Embeddings);

SELECT     t.id
	,s.distance
	,t.title
FROM     VECTOR_SEARCH(        TABLE = [dbo].[wikipedia_articles_embeddings] AS t,         COLUMN = [content_vector],         SIMILAR_TO = @qv,         METRIC = 'cosine',         TOP_N = 10    ) AS s
ORDER BY s.distance