A Datasource view is a critical component of a Analysis Services Cube. The data source view is the first point at which object required by the cube get defined. Therefore it is important to understand the details of how to use the Datasource view to simply the cube design. Let is first look at how to create the Datasource view then explore some important aspects of working with it.
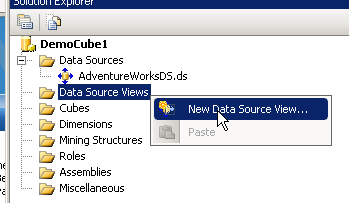
In this post we refer again to the Democube project that was created in previous posts. Navigate to the solution explorer and right click the data source view folder and select New data source view.
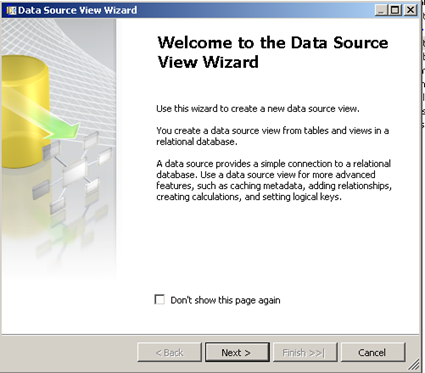
The below wizard should appear, press next
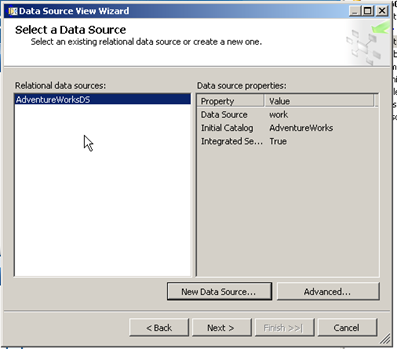
Select the data source from which we will import objects into the data source view from the below screen.
As shown in the below screen a list of all tables and view within the database to which the user account has permissions will appear.
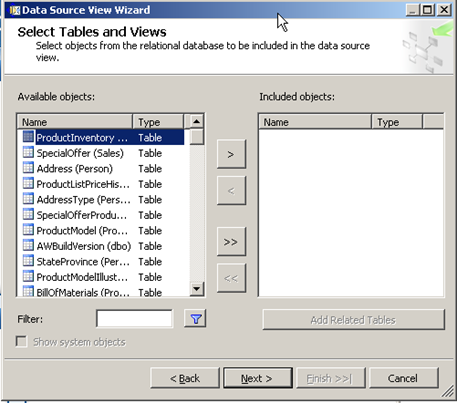
Select the tables as required from the left hand side and move them into the right hand side pane by pressing the “>” button. If there are too many tables you can filter them by searching by name within the filter text box provided.
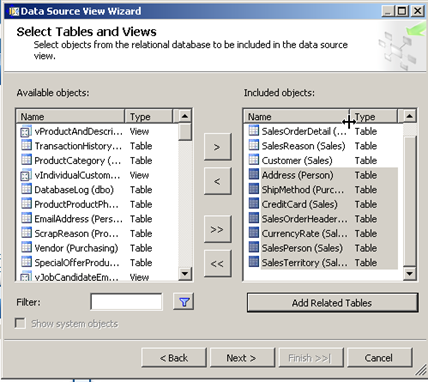
You can also add additional related tables (based on PK and FK relationships) by pressing the Add related Tables Button as shown above. Here we are mainly looking to import tables related to sales in order to create the sales cube. Press Next
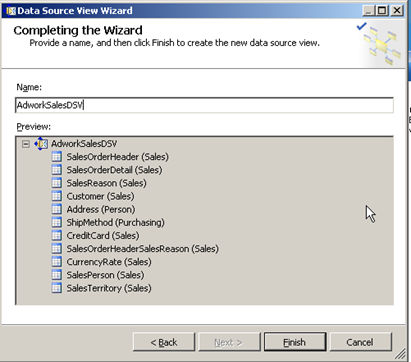
In the next screen specify a new for the Datasource view and press Finish
The Datasource view should appear in the Solution Explorer. Along with windows that display the ER diagram for the tables defined in the Datasource view as shown below.
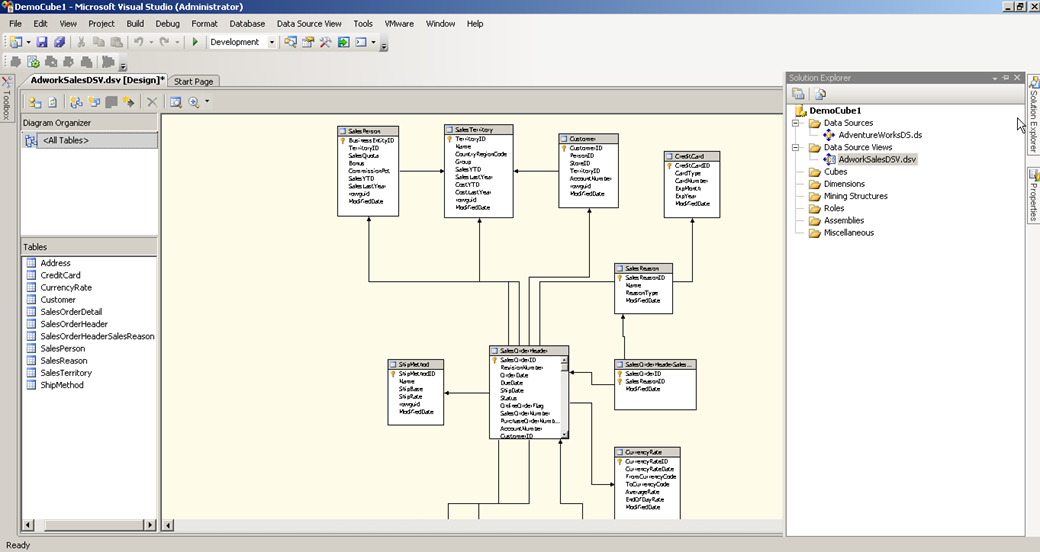
With this we have created a data source view , in the next post we explore the data source view in a bit more detail.
Please Consider Subscribing