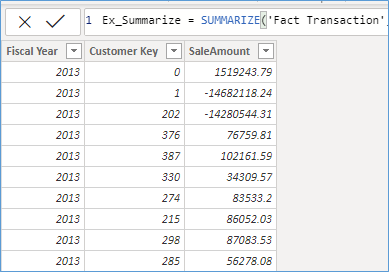
A useful function when measures need to be created on top of summarized data the SUMAMRIZE Function as its name suggests returns a table containing aggregates based on some grouping. In this example we can see a Table created which summarizes the SaleAmount from the Transactions Table Grouped by the year and the CustomerKey. Basically showing how much each customer spent each year.
The Formula to achieve the above result is
SUMMARIZE('Fact Transaction','Dimension Date'[Fiscal Year],'Fact Transaction'[Customer Key],"SaleAmount",SUM('Fact Transaction'[Total Including Tax])In order to visualize this lets create a table using the above formula as shown here

In the next post we continue to use the summarize formula in combination with TOPN to find the top 2 customers in each year.
The SQL Equivalent is a virtual table returned by the query below
SELECT [Calendar Year]
    ,[Calendar Month Number]
    ,sum(Quantity)
FROM fact.[order] o
INNER JOIN Dimension.[Date] d ON d.DATE = o.[Order Date Key]
WHERE Quantity > 100
GROUP BY [Calendar Year]
    ,[Calendar Month Number]
Please Consider Subscribing
