In this post we cover how to create a report in MS SQL Server 2012 Reporting Services. The bog covers using the wizard to connect to a database and then populate the data from the query into the table.
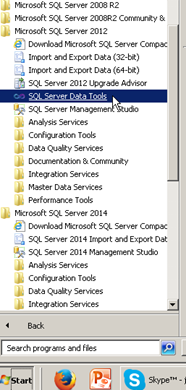
First we open VS 2010 or VS 2012or SQL Server data tools. Navigate to visual studio or MS SQL Server folder and open up the link for SQL Server Data Tools or VS 2012/ VS 2010. In this report we want to show number of nominations for trainings by the coordinator in order to identify which coordinator is conducting the most training
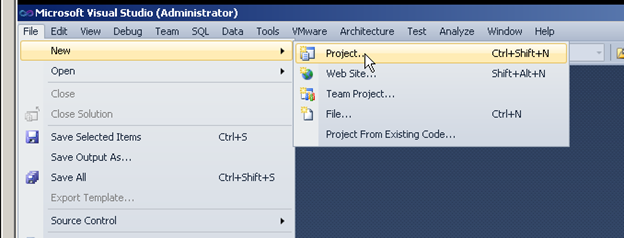
Click File > new > Project as shown below
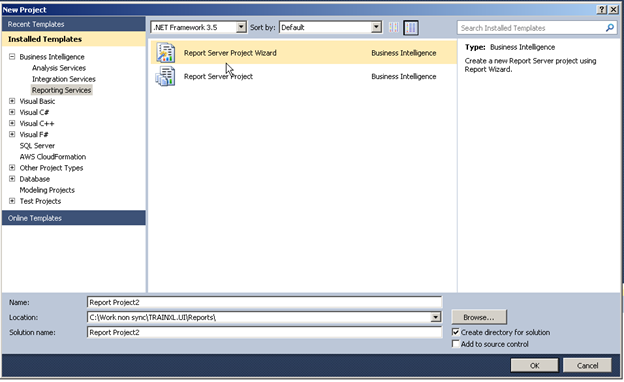
In the below screen select Reporting services and then select Report Server Project Wizard and change the path and folder and solution name as required and press OK
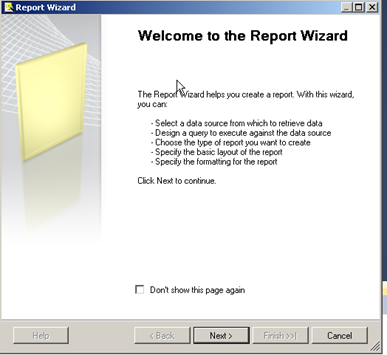
You will next see a pop up PRESS NEXT
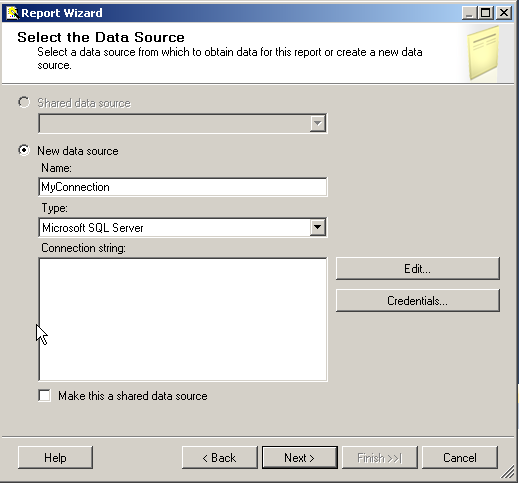
In the next screen , give the connection to identify the server to which it connects and then select the server name by clicking Edit.
If you want to use the same connection for multiple reports check the box below to make the connection a shared one , this allows other reports to reuse the connection.
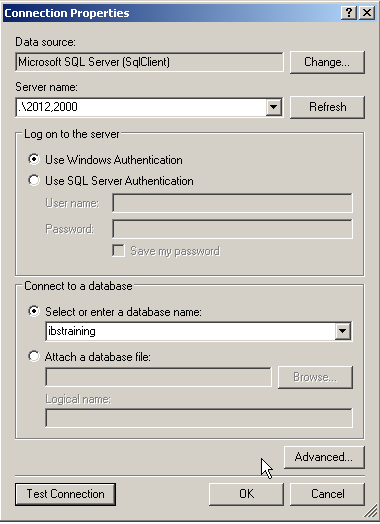
In the below screen enter the server name and the security credentials used to connect to the database such as Windows Authentication or SQL Authentication. And select the database name, press Test Connection to verify if the setup.
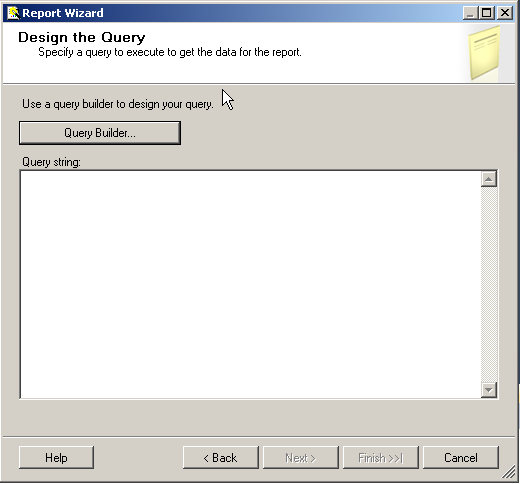
Press OK to get to the screen below, Copy paste your query in the textbox and press OK. If you do not have a query, select the query builder button and use the designer to create your query.
The below screenshot shows the query designer , select the Add table button and add a table and select the columns you want to add , You can also add additional tables and join table by dragging and dropping the join columns to each other.
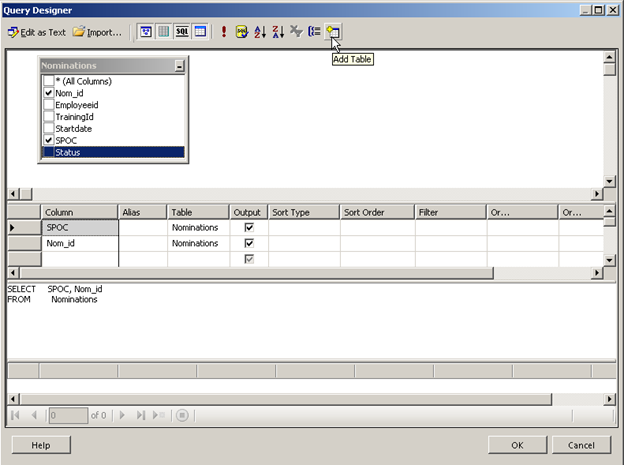
Once you have finished the query press the exclamation mark to run the query and then press OK.
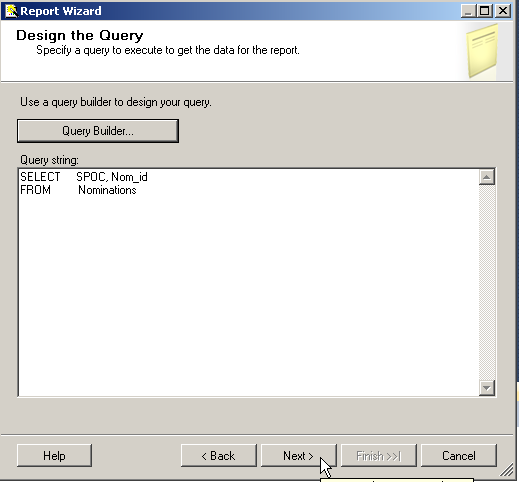
Press Next on the above screen to get the below screen
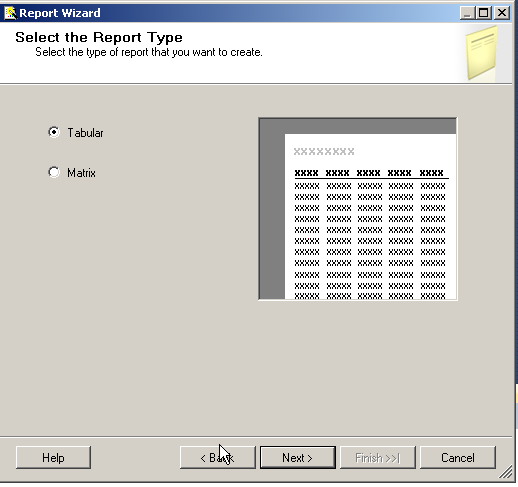
A Tabular report has a static list of columns like the number of hours in a day; the matrix Report has a dynamic column list such as the number of airlines flying a particular sector on the day.
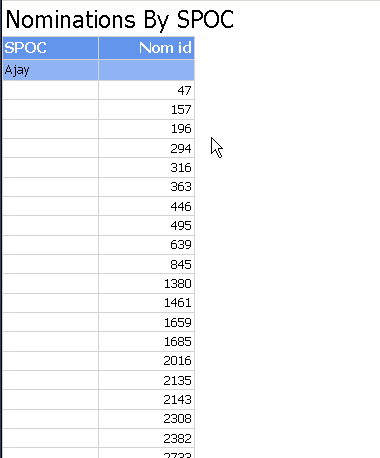
In our case we are using the tabular report since it is the easiest to represent. All data and be represented in either reports it is just the presentation that changes. In the report we want to show number of nominations for trainings by the coordinator in order to identify which coordinator is conducting the most trainings. We want to group by SPOC (coordinator) and show the count of Nomination_id. So we select the SPOC as Group and the Nomination_id as the details. Since Nomination id is int a sum will give us an incorrect number but since nomination id is unique a count will give us accurate results.
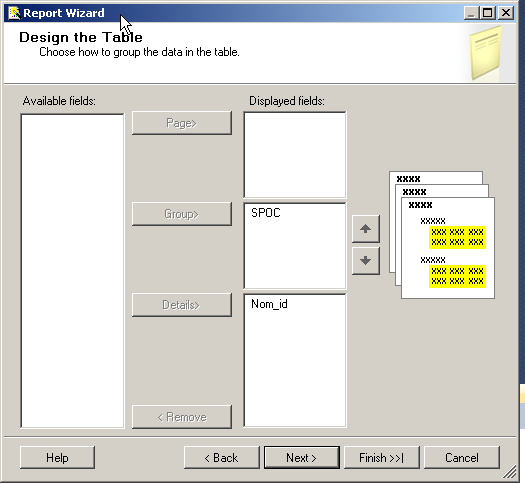
Press next to get the below screen
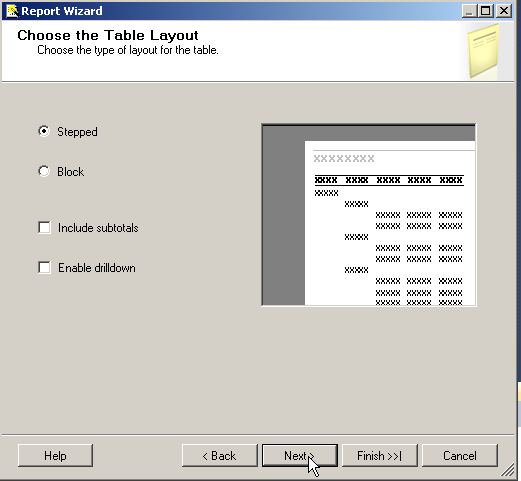
We do not want subtotals or drill downs since we have a very small data set of three rows and totals do not make sense in the context of the report. Stepped and Block just change the layout of the groupings.
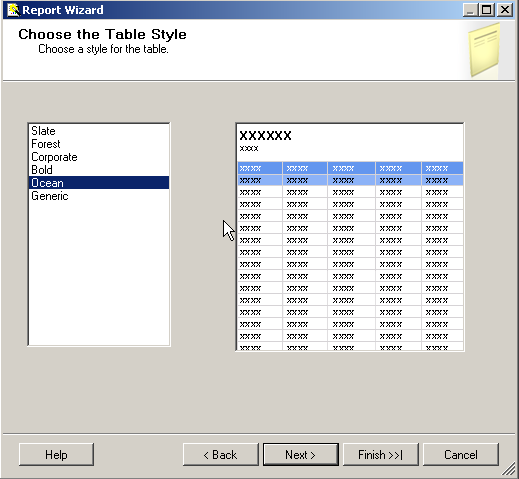
The next screen allows you to select a template pre-defined by MS you can choose generic and customize as per your own requirement. Press Next
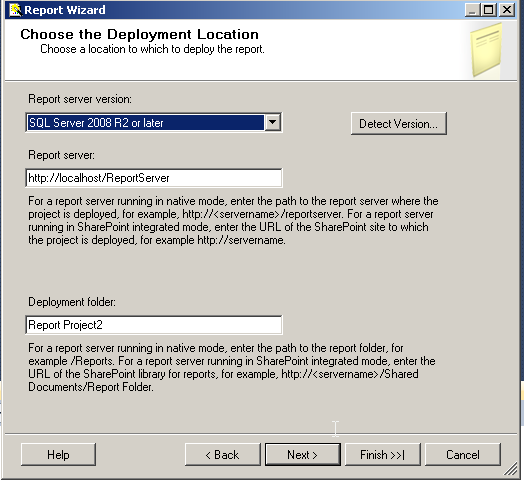
The next screen shows the deployment options for SSRS , the values are automatically provided based on your installation, There is no need to change anything here for development purposes.
Press Next and change the Report Name to something meaningful
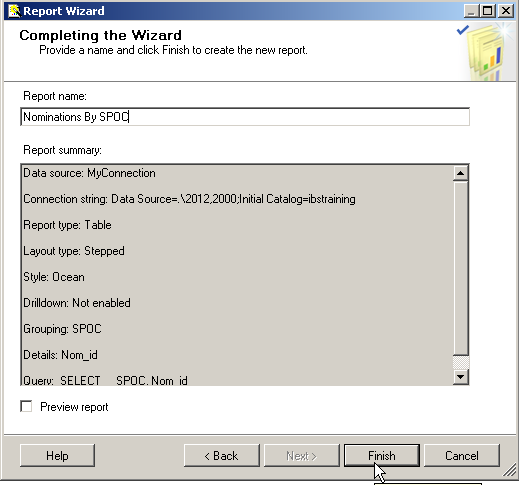
Press Finish to see the report preview after checking the box for Preview Report.
Please Consider Subscribing