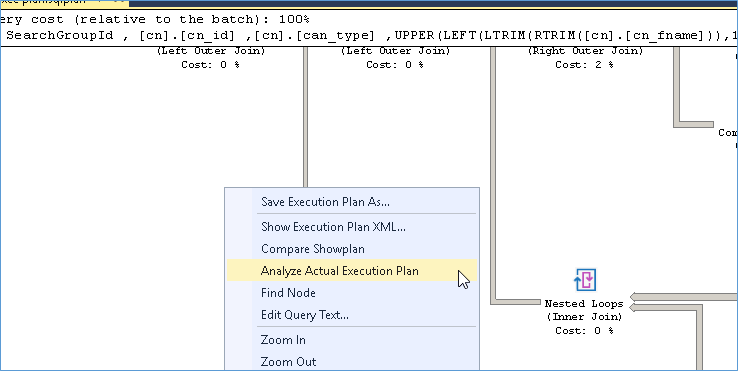
This might be a hidden gem in SSMS that most people aren’t aware of so I figured I would post about it. I recently used this feature to understand the impact of inaccurate cardinality estimate on the performance of a query. In order to view this option you need to run the query within SSMS while selecting the Actual Execution Plan option. Once the plan is displayed you can right click anywhere within the plan to see the below option.
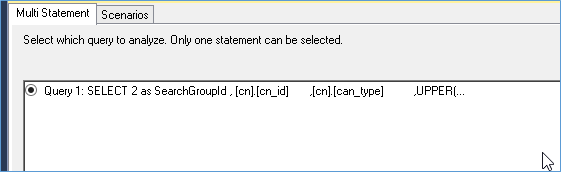
After this you will see a screen as shown below where you need to select a single execution plan from the results. Mostly this happens because there is a function call or multiple batches within the query. You can analyze only one at a time.
You will notice from the above screenshot there is a tab called Scenarios. Click the tab to explore where all the Cardinality Estimator might be impacted.
An example would look like below
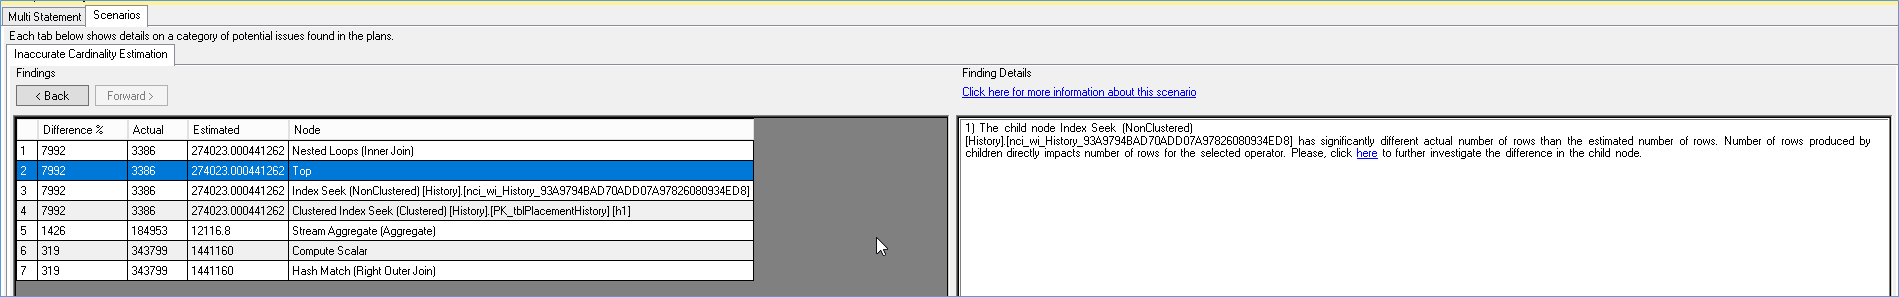
In this case we can see the joins and other operators are impacted by the difference in the number of rows, which could mean either:-
- Parameter sniffing
- Stale Statistics
- Cardinality Estimator issues
And this way we can identify some high level issues within the plan. Please note right now the tool only identifies issues with the estimator but in future release we can expect more robust analysis for other metrics as well. You can also compare differences between plans which becomes really useful for studying the impact of code change or post ETL workloads and Parameter sniffing.
References
Please Consider Subscribing