One the best parts of using analytics engines are their ability to understand dates and other types of hierarchies. As human being we use time as a core aspect in our measurement of change. Things like sales week on week or week over week. Year till date, month till date are all important calculations we need to perform. However the challenge has always been that standard approach to RDBMS and EF Codds rules for databases requires no understanding of the nature of the data and treats every row atomically. In other words as far as traditional RDBMS are concerned there is no reason for one row to have any dependency on any other row within the same table. The most common example of this being that there is no inherent order to the data.
With DAX and the tabular model we have the ability to take row by row data and work on it using hierarchies we see in the data without having to make it a cube or some other format. The biggest advantage of this being that we can now perform analytics on small sets of data without having to worry about the complexity of building a cube.
In order to demonstrate this I am using the PowerPivot component within Excel but the steps are similar when even doing this within SSAS tabular model. The three most important things that need to be in place for Time Intelligence are:-
- A table with the continuous range of dates. Continuous means no missing dates between the minimum and maximum dates within the table.
- A relationship between the date within the above calendar table and the fact table which is being interrogated.
- Mark the calendar table as a date table so that DAX knows to treat dates as such.
Below are screenshots to show the steps involved.
Step 1
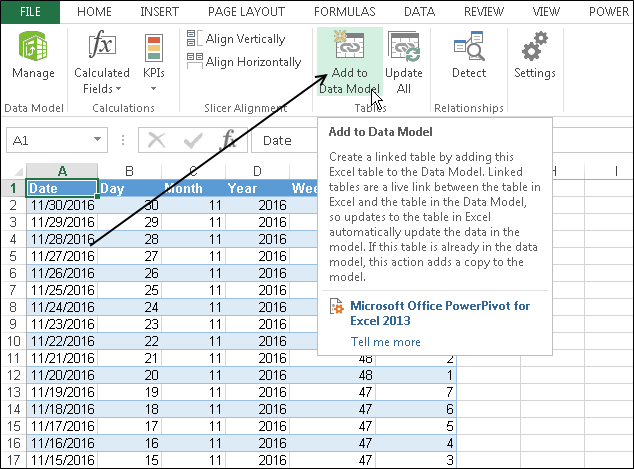
Create a date table, you can create one directly in Excel or simply import one from within a table in the database, it would look something like this. Notice that I also click Add to Data Model so that PowerPivot know to bring the data from the sheet into PowerPivot model so that I can perform the rest of the steps.
Step 2 Add a relationship between the tables.
At this step please note that PowerPivot only allows one relationship between tables. So if you have multiple dates within the Fact table (the Foreign Key table) then you need to import multiple calendar tables and establish relationships for each one individually.
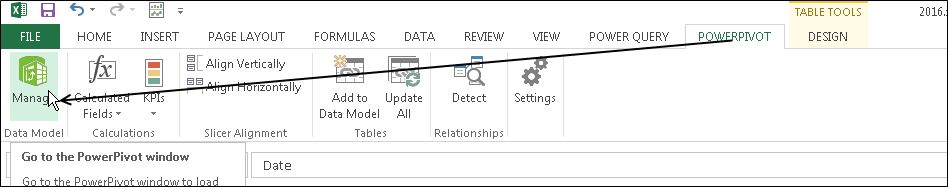
Navigate to the PowerPivot tab on the top and then press the manage button as shown below
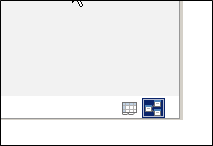
Next click the relationship view button on the bottom right of the screen and drag and drop the column from FK table ( Fact Table) to the PK table ( calendar table).
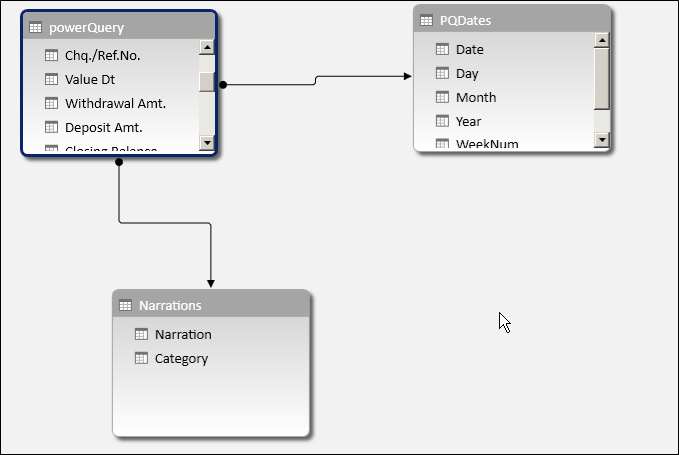
As you can see in the below query I am using three tables and the table PQDates is joined to the table Power Query using Date column and Value Dt columns.
If you get any errors while dragging and dropping the relationship most likely it is because of
- Incorrect datatype (one of the date columns might be stored as text, fix this the same way you change datatypes in Excel).
- You’re dragging and dropping from the wrong table, drag from FK to PK table not vice versa.
- There might be duplicates in the PK table as a result of which it’s not able to tell which the PK table is.
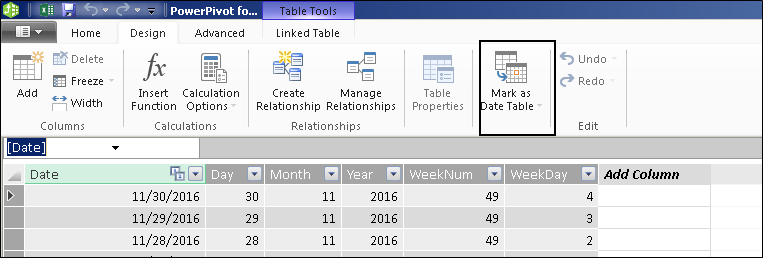
Step 3 Mark the calendar table as Date Table
Go back to table view by clicking the table view icon on the bottom right of the screen
Open the sheet containing the date’s table, in my case its PQDates. Under the Design tab there is a button for Mark as Date table. Click it and select the column that contains the unique dates from the calendar table. In my case this is the Date Column.
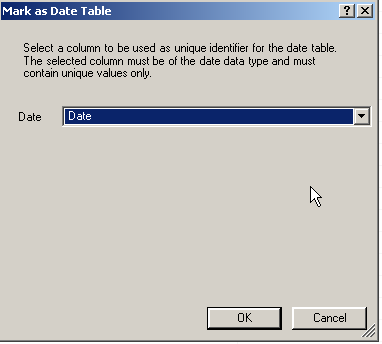
Press OK.
With this we have configures the Date intelligence functionality for DAX the only thing left to do is write a DAX function to leverage it.
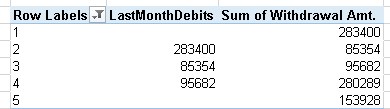
In the below formula I am calculating the amounts withdrawn in the previous month so that I can compare it against the current month.
![]()
![]()
Notice the use of PreviousMonth DAX function. This function automatically returns a list of dates for the previous month based on the month I am looking at. Since the numbers are calculated within the context of a particular month you will see that the Measure at the bottom half of the screen show Blank. This is not an error but simply letting us know that we need to view this measure within the context of months.
Here is what the screenshot will look like without Months.
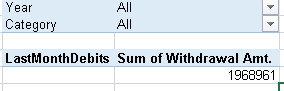
Here is a screenshot with the months added
And that’s all there is to it. One word of caution here is to make sure that you only have date components in your date columns, if one column has a date like 2016-01-01 and the other has 2016-01-01 13:54:00 then they won’t be able to match up with each other. Make sure the grain for the columns are the same.
Please Consider Subscribing